
The fundamental case for value outperformance in coming years remains strong but a more selective approach may be warranted that seeks to avoid value traps. These value traps, cheap companies whose debilities have not yet been fully reflected in prices, increase risk and erode returns for value investors.
Based on a 32-year study of US equity performance, an investment strategy that succeeds in avoiding value traps provides better upside potential through more concentrated yet less risky exposure to the least expensive stocks. Screening out characteristics that signal value traps is a simple way to achieve this.
Low quality and sentiment-driven momentum are common features of value traps. By purging problem stocks using momentum and quality signals, returns improve across all but the most expensive companies. These improvements are most notable in the two cheapest valuation quintiles of the market, with the projected value premium increasing by an estimated 5.2% per year.
An investor has to do very few things right as long as he or she avoids big mistakes.
”Warren Buffett, Berkshire Hathaway Inc 1992 Shareholder Letter
After a decade in the wilderness, value investing roared back to life in 2022, led by long-forsaken sectors such as energy, industrials and even certain retailers. Many portfolios had either intentionally or unintentionally migrated heavily towards “growth at any price” exposures and were caught wrong-footed that year. Research conducted in 2020, at the depths of value underperformance, revealed that the contemporaneous preference for growth stocks was not sustainable in the long run (Arnott, Harvey, Kalesnik, and Linnainmaa, 2020). The researchers estimated that, even if the relative valuation of value and growth stocks were to remain extreme, the structural components of value should lead to annualized outperformance of 4.5% per year. Should the relative valuation gap revert to a more normal level, the outperformance of value would be even greater.
Create your free account or log in to keep reading.
Register or Log in
Despite the intensity of the value rebound in 2022, the fundamental case for value to outperform growth in the coming years remains strong. The value performance pause in 2023 offers investors an opportunity to rebalance their value and growth exposures. That said, the “easy part” for value outperformance (bluntly picking value stocks with cheap valuation ratios) may be behind us, and a more selective approach may be warranted in the future.
Long-term investors have steadily been drawn to buying underpriced companies and patiently waiting for them to increase in value. However, among the cheapest companies there are some that have very good reasons to remain underpriced, some whose debilities have not yet been fully reflected in the price, and some that are on their way to insolvency. These “value traps” with long downside tails represent a cost to value portfolios, weakening risk-adjusted (and absolute) returns. An investment strategy that succeeds in avoiding most of these traps provides better upside potential over time, allowing investors to achieve more concentrated yet less risky exposure to the least expensive stocks.
The Cost of Value Traps
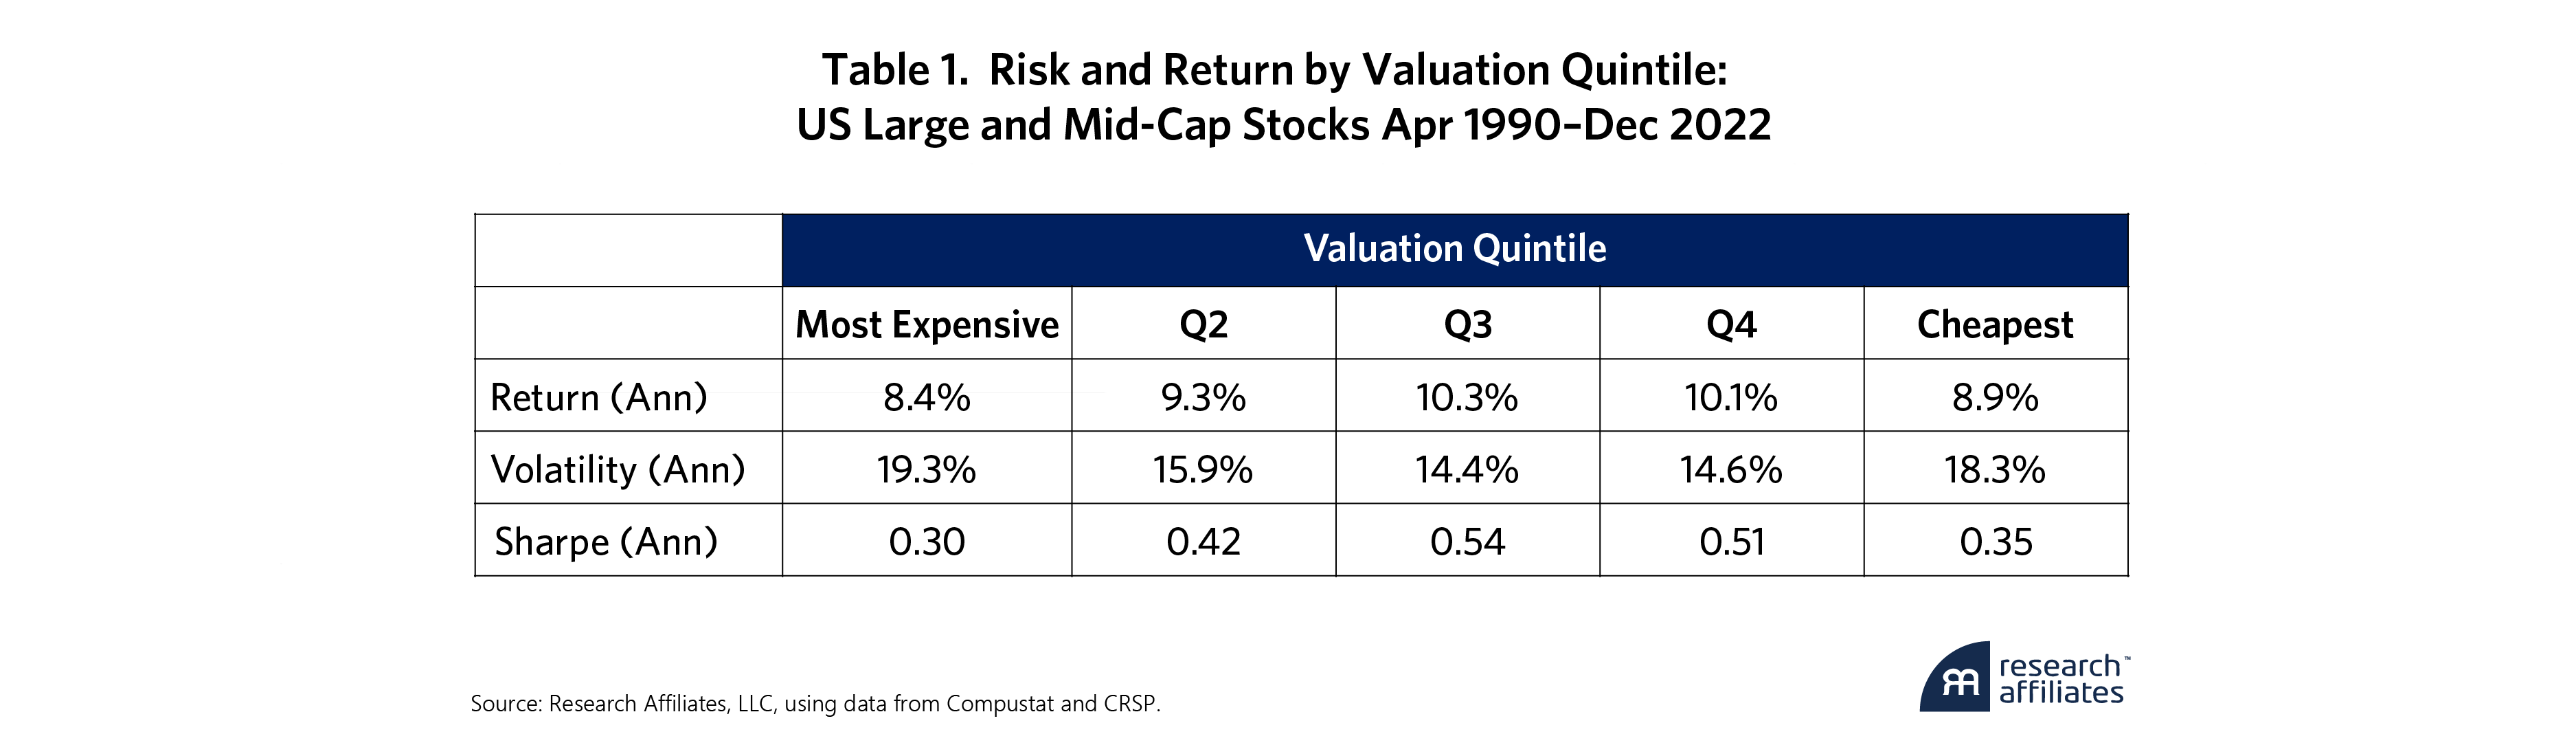
To illustrate the cost of value traps, we employed a simple valuation metric as the basis of a simple value investment strategy. Using the classic Fama-French book-to-market ratio, we divided the US large and mid-Cap stock universe into capitalization-weighted quintiles from least to most attractive. We conducted this sorting once a year, at the end of March. Investment in the most inexpensive (attractive) quintile represents the deepest value exposure while investment in the most expensive (unattractive) quintile represents the strongest anti-value or growth exposure. As of this writing, the most inexpensive quintile of stocks trades at a 70% discount to the overall market, while the most expensive group of stocks trades at a 570% premium. This staggering relative pricing manifests the opportunity that still exists in value stocks today. Historically, these relative pricing opportunities have been substantially smaller, averaging -60% for the cheapest quintile and +300% for the most expensive quintile. We calculated the returns and risk for each valuation quintile over the period from April 1990 to December 2022. This 32-year span is unbiased because it encompasses two distinct intervals of strong value outperformance (1990–1996 and 2000–2007) and two intervals of strong growth outperformance (1997–1999 and 2014–2020).
Rather than ruling out the entire pool of the lowest valuation stocks, we suggest some simple ways to sort the gems from the traps.
”The results of book-to-market investing over the measurement period are underwhelming. As shown in Table 1, returns increase with cheapness until we reach the last two—and most underpriced—quintiles. The second cheapest quintile does no better than the middle quintile. But the cheapest quintile has the most telling outcome: its return is no better than that of the second most expensive quintile, with greater volatility.
The cheapest quintile is the final stop for all the companies traversing the expensive-to-cheap line, which makes it more prone to hold a relatively stable group of companies that achieve the value premium in a longer-term period compared to the second cheapest quintile. This is apparent in the global financial crisis, where the higher turnover of the second cheapest quintile allowed it to reduce exposure to the financials sector just in time to attenuate its sensitivity to the carnage that ensued. This largely explains the lower return of the cheapest quintile vs. the second cheapest quintile.
The cheapest quintile holds companies so structurally challenged that they either remain severely underpriced, or worse, go out of business. These companies, which we call value traps, are often described as “cheap for a reason.” Their risk and return characteristics erode the portfolio performance of deep value investors.
This value trap phenomenon is well documented and has led many investors to exclude the cheapest stocks, preferring to fish for value in safer pools. But is this really the best approach? By categorically excluding stocks in the cheapest quintile, one is also proscribing many out-of-favor stocks with very attractive upside potential. Rather than ruling out the entire pool, we suggest some simple ways to sort the gems from the traps, improving both risk and return to value investors.
The Role of Quality
In 2015, Chris Brightman and his co-authors showed that companies with similar dividend yields can vary significantly in financial quality1, and, therefore, in their capacity to sustain dividend payouts. By screening for higher-quality companies, dividend-oriented investors can avoid unknowingly investing in “lemons” and achieve more consistently high dividend yields. Likewise, very cheap companies can vary in quality. Some companies have sound fundamental businesses that have encountered a cyclical downturn. These stocks trade at a discount but are likely to revert to a more reasonable price as their businesses recover, and they represent attractive value plays. By contrast, other companies—value traps—are cheap because they are on their way to insolvency due to factors such as mismanagement, balance sheet weakness, or changes in the competitive environment. Here, we employ a similar quality screen to avoid these “lemons.” We focus on two distinct measures of quality, Low Distress and Investment:
Low Distress, including a mix of metrics considering a company’s capital structure and payout return to investors, is a proxy for balance sheet health that measures the adequacy of the company’s financing activities. It rewards companies that have a higher ability to cover their debt obligations and that do not rely considerably on leverage. Unless a company can stay solvent and survive its business downturn, it has no chance of closing a valuation gap. Another way to avoid distress risk is to identify companies with high payouts to shareholders: companies facing financial difficulties will be more likely to reduce their dividend payments (Coffinet, Pop, and Tiesset 2013) and/or shrink stock buyback activities to retain more cash.
Investment evaluates the company’s efficiency of capital utilization. Companies with relatively high investment are not necessarily more profitable, nor do they necessarily yield more for investors. They might be trading off healthy investor remuneration in the long run for empire building. Investors either don’t realize this initially or don’t care because they are drawn to these rapidly expanding, flashy companies. Over-pricing these companies results in lower returns once the firm experiences decaying earnings from these negative net present value activities
In evaluating quality, we are not seeking exposure to companies with the strongest distress and investment metrics, as that approach may not fit within a deep value investment framework. For example, many companies with sound capital structures and solid returns to investors, such as Cisco Systems, are more richly priced to reflect their low risk. Others may not be taking enough risk in their business to maximize growth and shareholder value. Rather than mixing in high-quality companies which dilute our value exposure, we merely avoid the worst transgressors of our quality definition. We do this by constructing a composite quality score based on Low Distress and Investment and removing roughly the bottom 25% companies with the worst quality metrics.
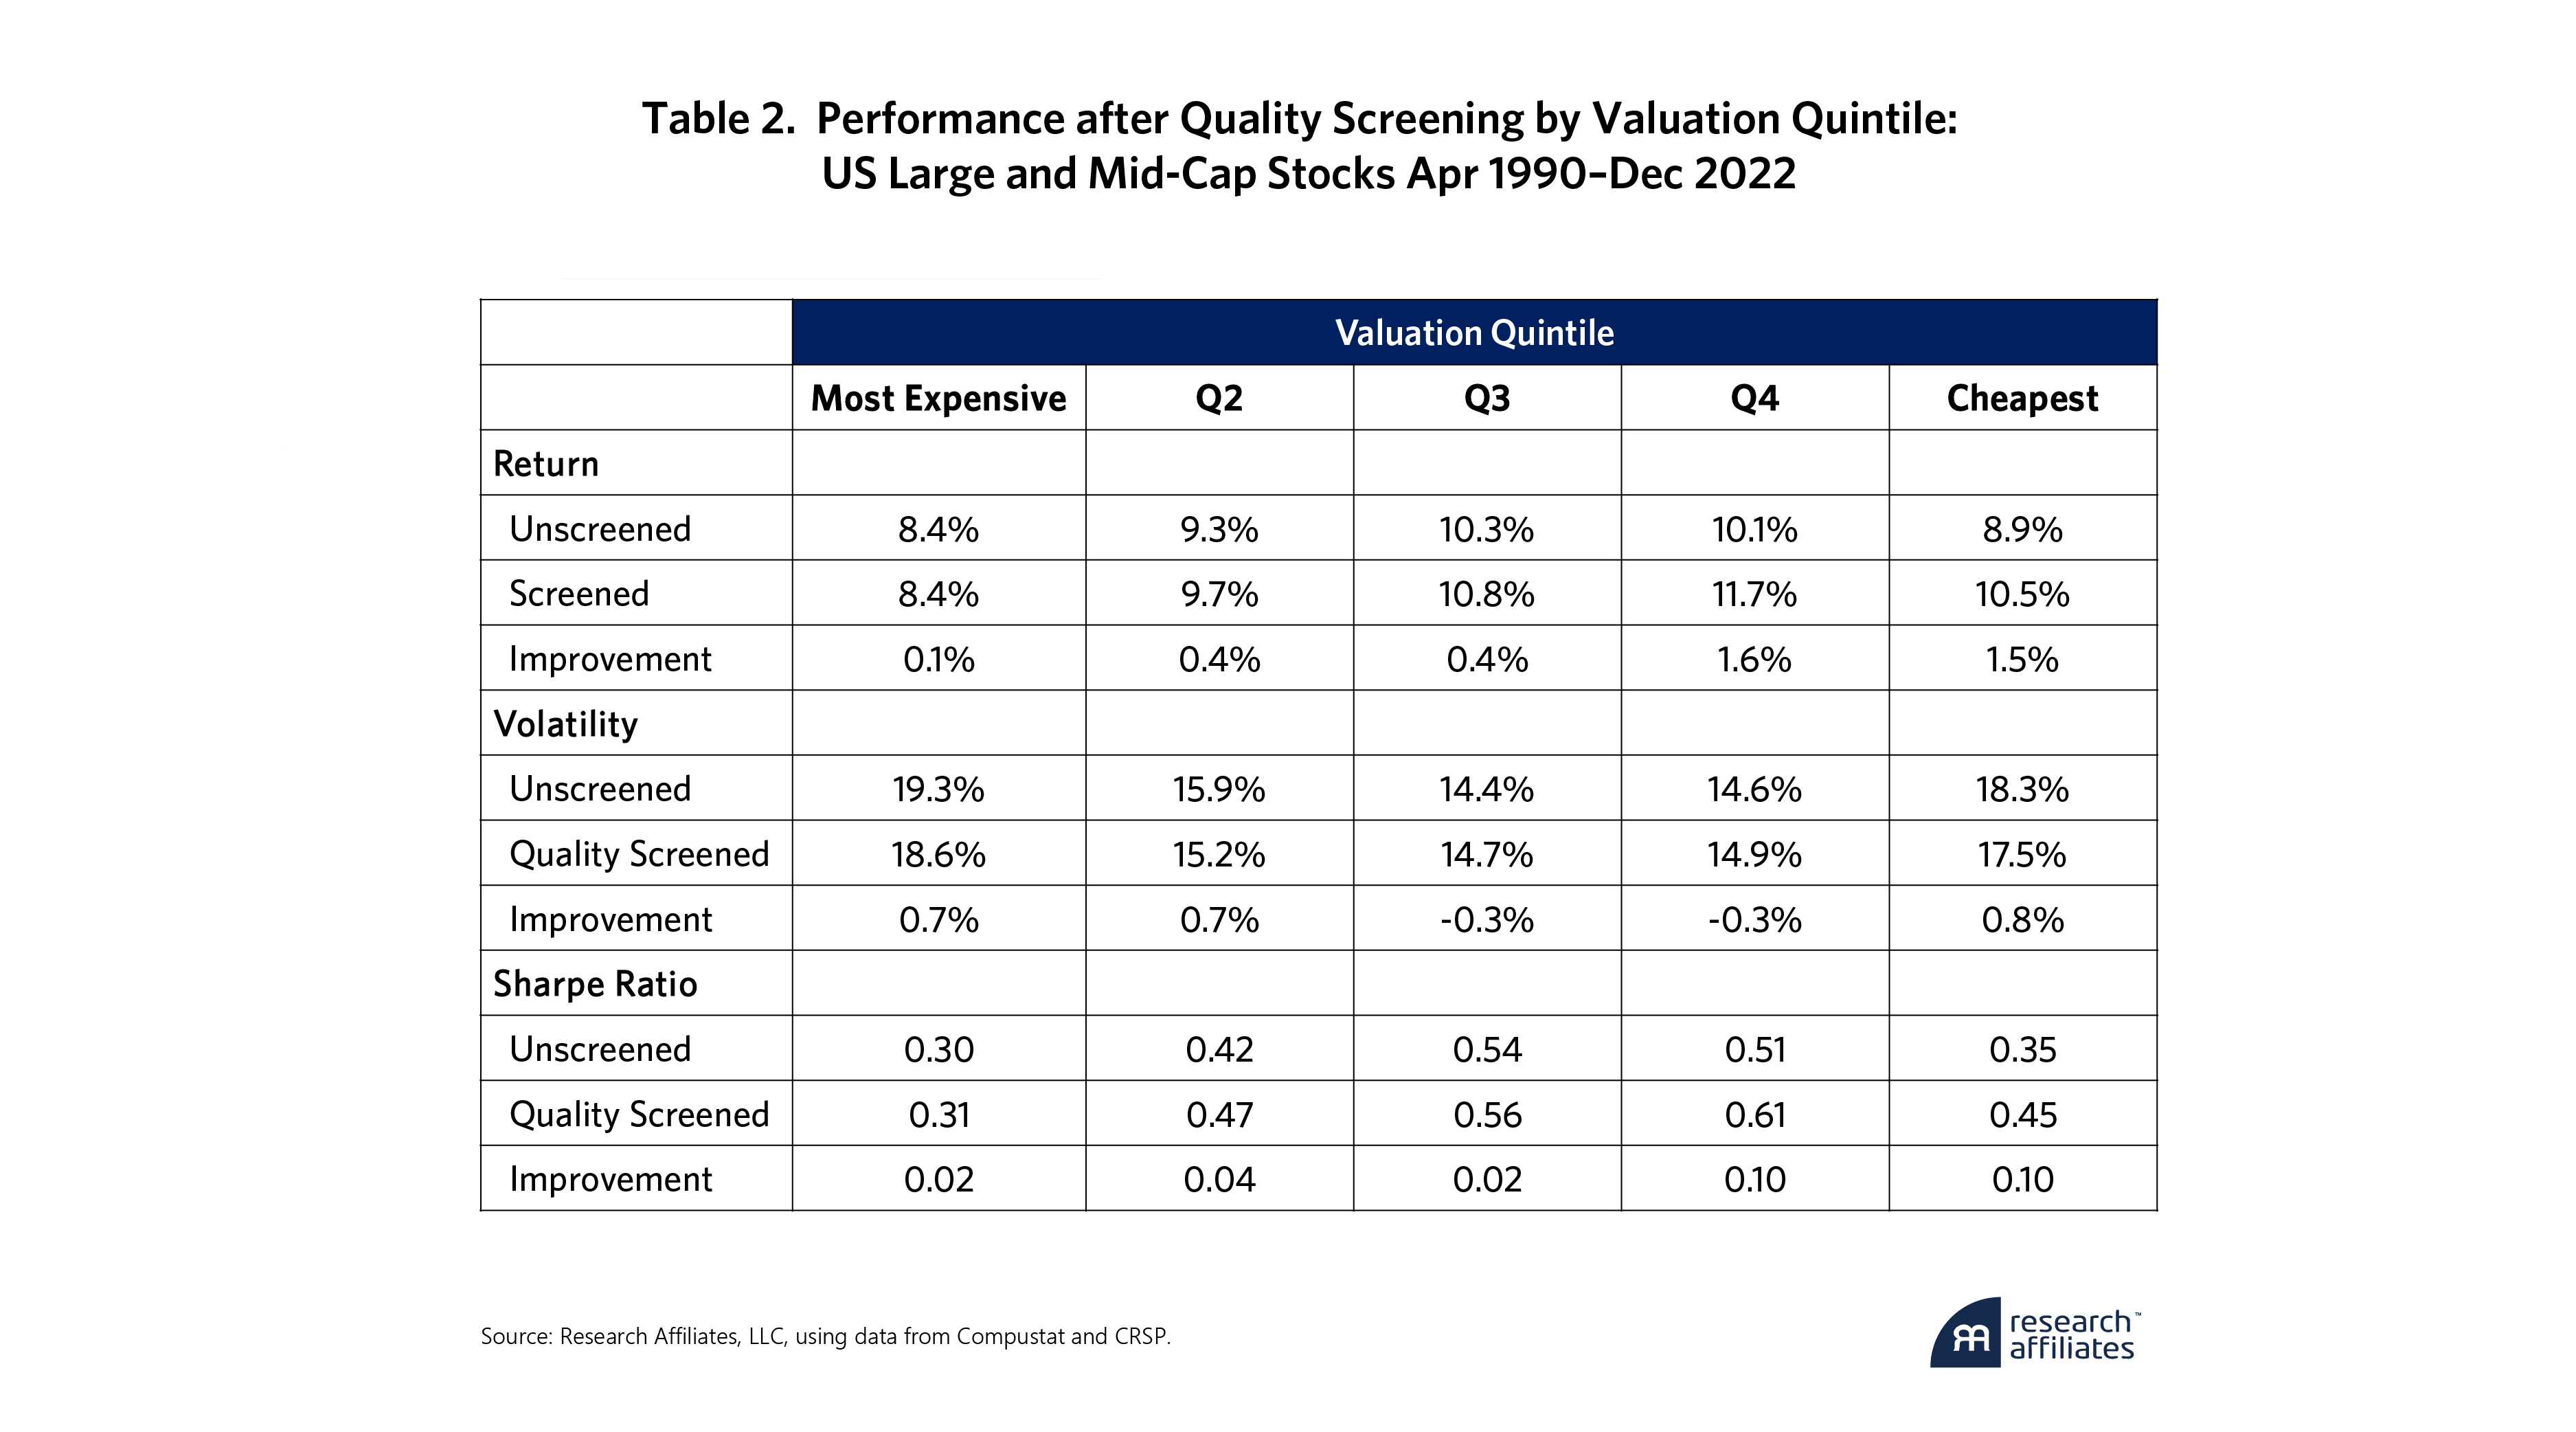
Table 2 shows the performance improvement by valuation quintile when low-quality stocks are excluded. Returns improve in all but the most expensive quintiles. Expensive stocks are less prone to outsized effects from insolvency risk than cheap stocks, rendering the quality screen less impactful. The two cheapest valuation quintiles display the most significant improvements to returns. Screening out these names allows Quintile 4 to achieve a rate of return exceeding that of the middle quintile and Quintile 5 to earn a return approaching it. Besides returns, we also observe volatility reduction in three out of five quintiles, and unsurprisingly we see the largest volatility reduction in the cheapest quintile by removing the “cheap for a reason” stocks.
The Role of Momentum
While screening for quality is intuitively appealing to most investors, the use of momentum is often controversial, especially among value investors. After all, a stock doesn’t become a value stock without suffering significant underperformance. By contrast, momentum seeks to pile into recent successes while avoiding out-of-favor companies. Nevertheless, aside from value, momentum is one of the best documented and most compelling sources of excess return, at least on paper.
As Rob Arnott and his co-authors wrote in 20172, the strong simulated returns to momentum have failed to materialize when momentum strategies are applied in the real world. The authors point to three traps that momentum investors should sidestep, including (1) high turnover in crowded trades, (2) a careless sell discipline disregarding the fact that momentum is subject to reversal effects, and (3) repeat winners and losers which have been rising or falling so long that they have little momentum follow-through.
Financial reporting is late and slow, whereas new information is more quickly, though not always fully, reflected in the stock price as sentiment shifts.
”In order to avoid these traps, we treat momentum not as a signal to bet on, but rather as a manifestation of market sentiment not to bet against. While fundamental data remains the most reliable indicator of a company’s worth, we acknowledge that financial reporting is late and slow, whereas new information is more quickly, though not always fully, reflected in the stock price as sentiment shifts. The most convincing explanations for the efficacy of momentum lies in behavioral biases. If the market initially underreacts to news about a company, the stock’s price action can continue to reflect obsolete information until the market overreacts.
The short seller report on the Adani family of companies issued early 2023 is a ready example. Hindenburg Research published the report on January 24, 2023, but the strong negative reaction came on January 27th with a -18.5% drop. After the company abandoned a planned share sale on February 1, the stock went on to have several double-digit return losses throughout the month, reaching a drawdown of –69% on February 27. From that point, it turned around and recovered 91% through the end of May.
The Adani episode illustrates both the initial underreaction as well as the subsequent over-reaction and the reversal that are characteristic of momentum. By avoiding value companies with the worst momentum, we are seeking to preclude investment in stocks that could be value traps in the making. Stock prices may reflect information about these companies, but the slow nature of financial reporting has not yet captured (and may not capture) the dynamics of underreaction, overreaction, and reversal.
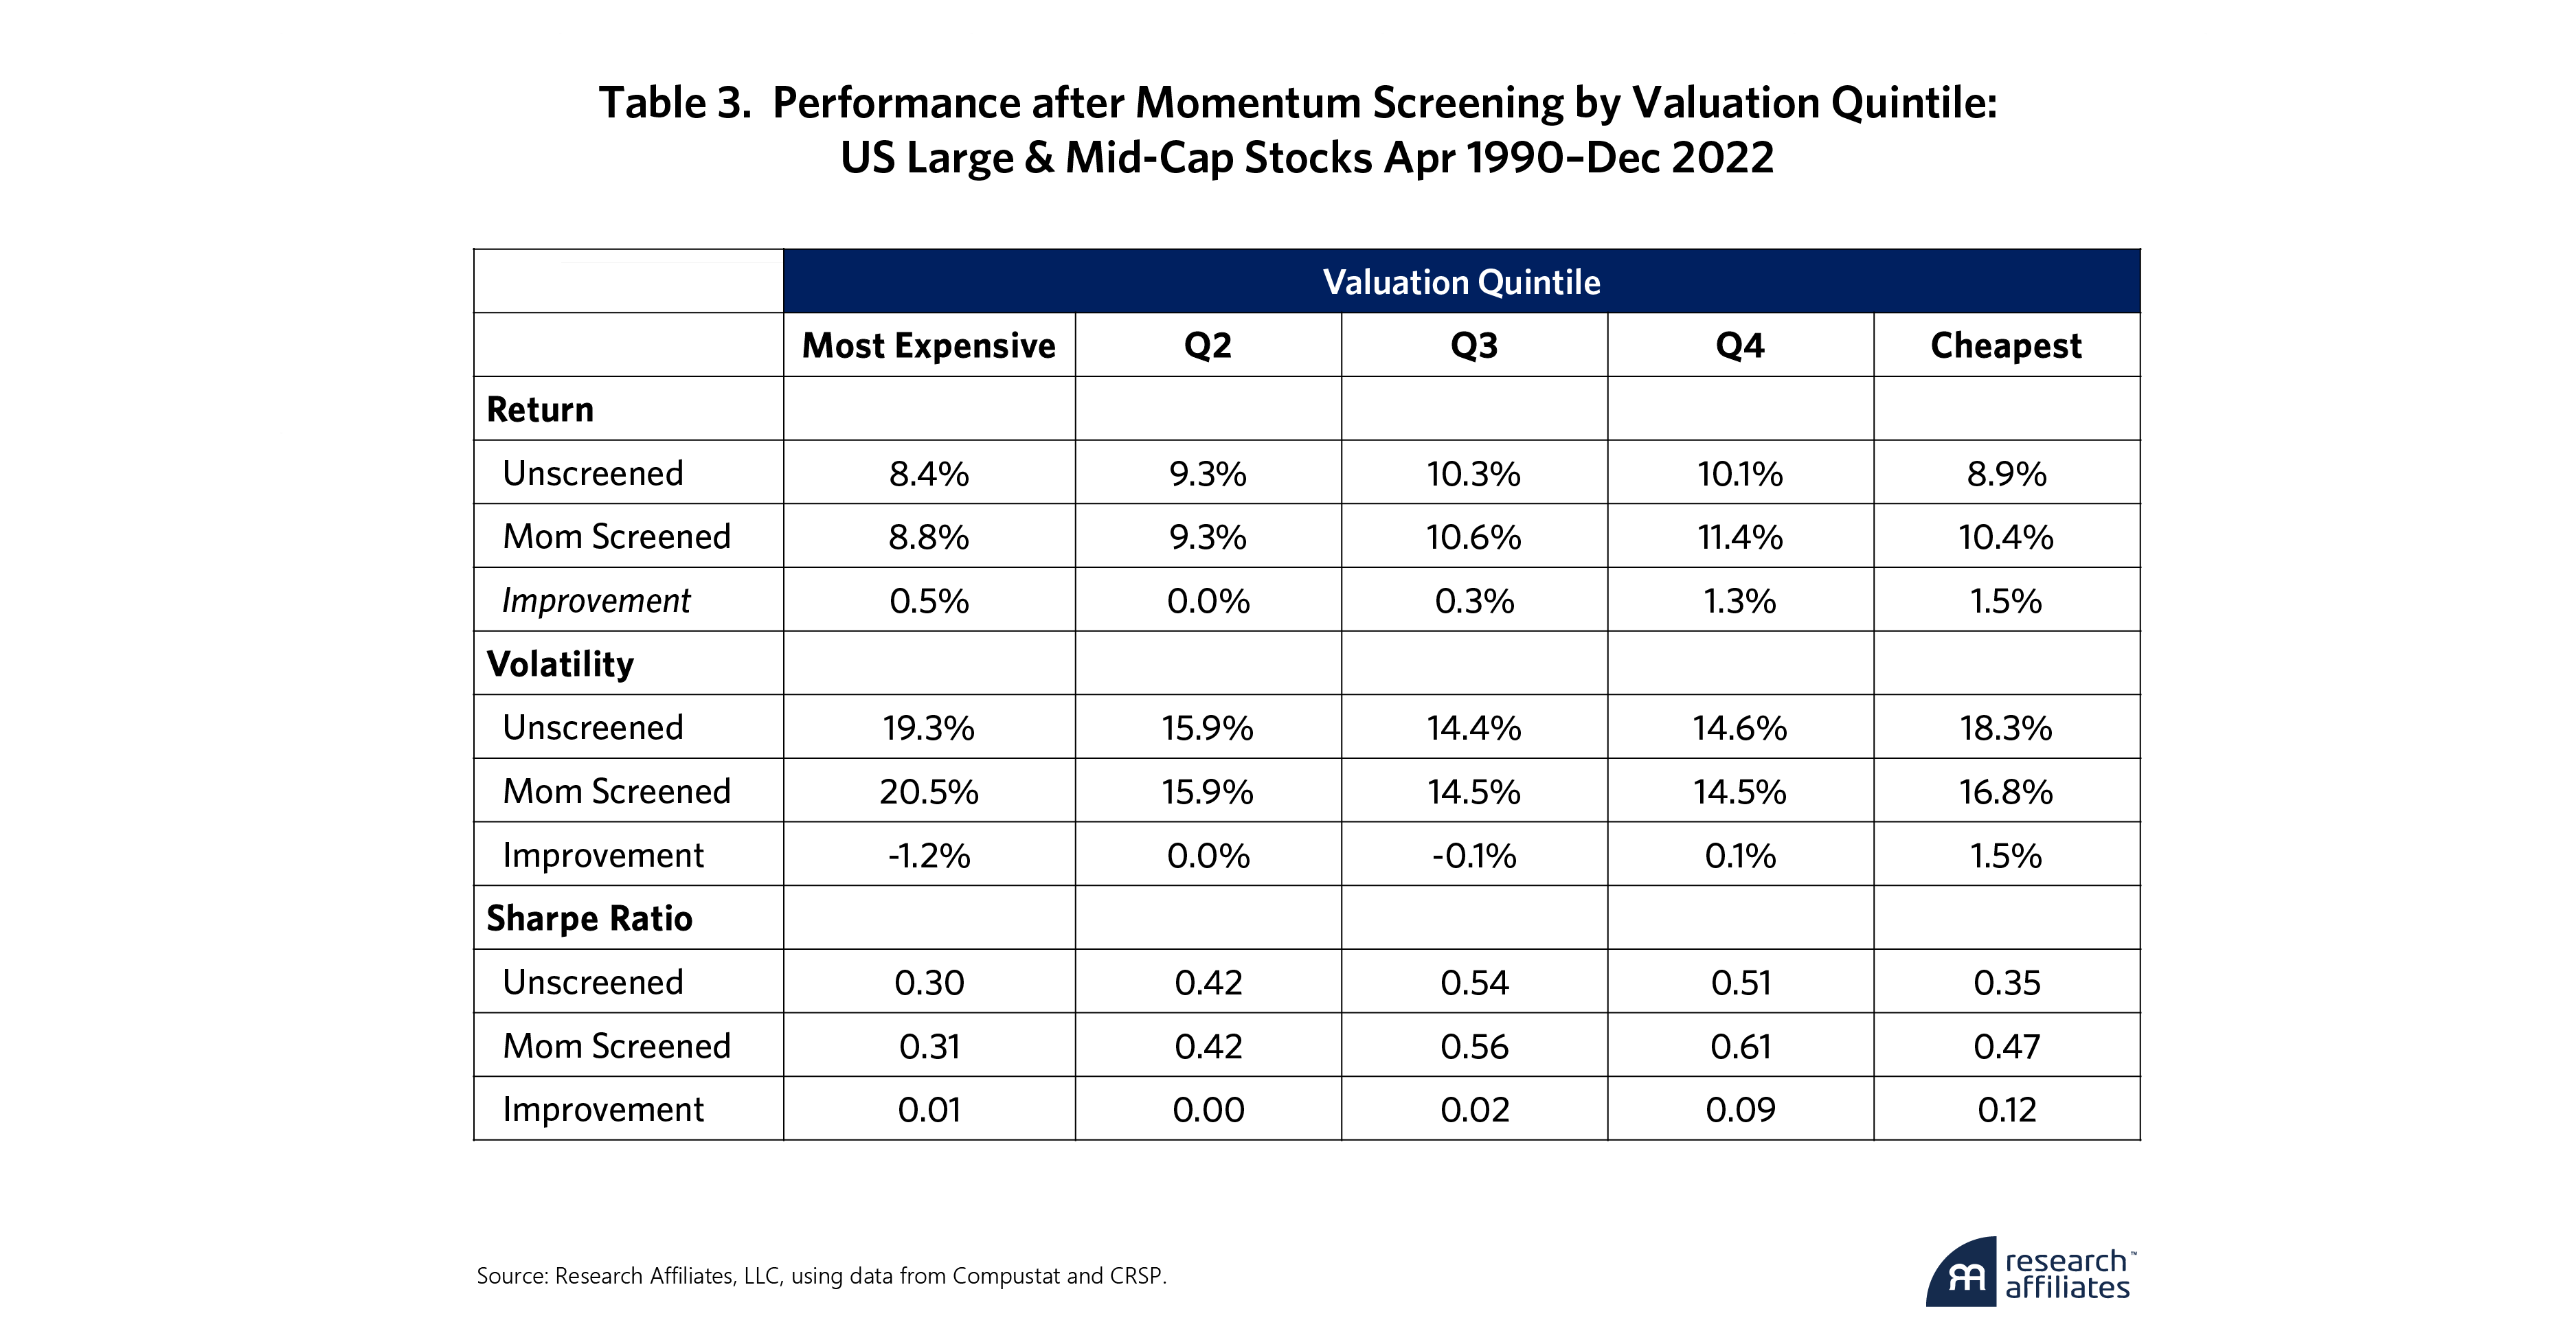
Parallel to the way we approached quality, we created a composite momentum score based on a variety of risk-adjusted momentum measures, and we again excluded roughly 25% of the bottom companies with bad momentum from our US large-mid universe. Table 3 shows the returns by valuation quintile when poor momentum stocks are removed from the portfolios. As they did for quality, returns improved in most valuation quintiles, but the improvements were most significant in the two cheapest categories. Investors in growth stocks are less exposed to “falling knife” situations, while deep value investors should be wary. By removing poor momentum stocks, the cheapest quintile has lower risk and earns a rate of return that exceeds those of the more expensive quintiles.
Combining Quality and Momentum Screens
Having separately demonstrated the benefits of avoiding poor quality and poor momentum names in value investing, we bring both concepts to bear in investment selection. In doing so, we can choose a less restrictive criterion that excludes stocks with both poor quality and poor momentum. Alternatively, we can choose a more rigorous screen, which eliminates stocks with either poor quality or poor momentum. The second approach would result in removing more stocks, leaving more concentrated portfolios. However, if poor quality is a value trap, it makes little sense to continue holding poor quality stocks just because they have decent momentum. Likewise, it makes little sense to buy falling knives just because they have acceptable quality characteristics. Accordingly, we chose the stricter screen, where stocks are eliminated if they have either poor quality or poor momentum. Overall, this screen rules out approximately 40% to 45% of companies in the opportunity set.
Holding poor momentum or poor-quality stocks does little to benefit portfolio diversification but rather leads to “diworsification” for value investors.
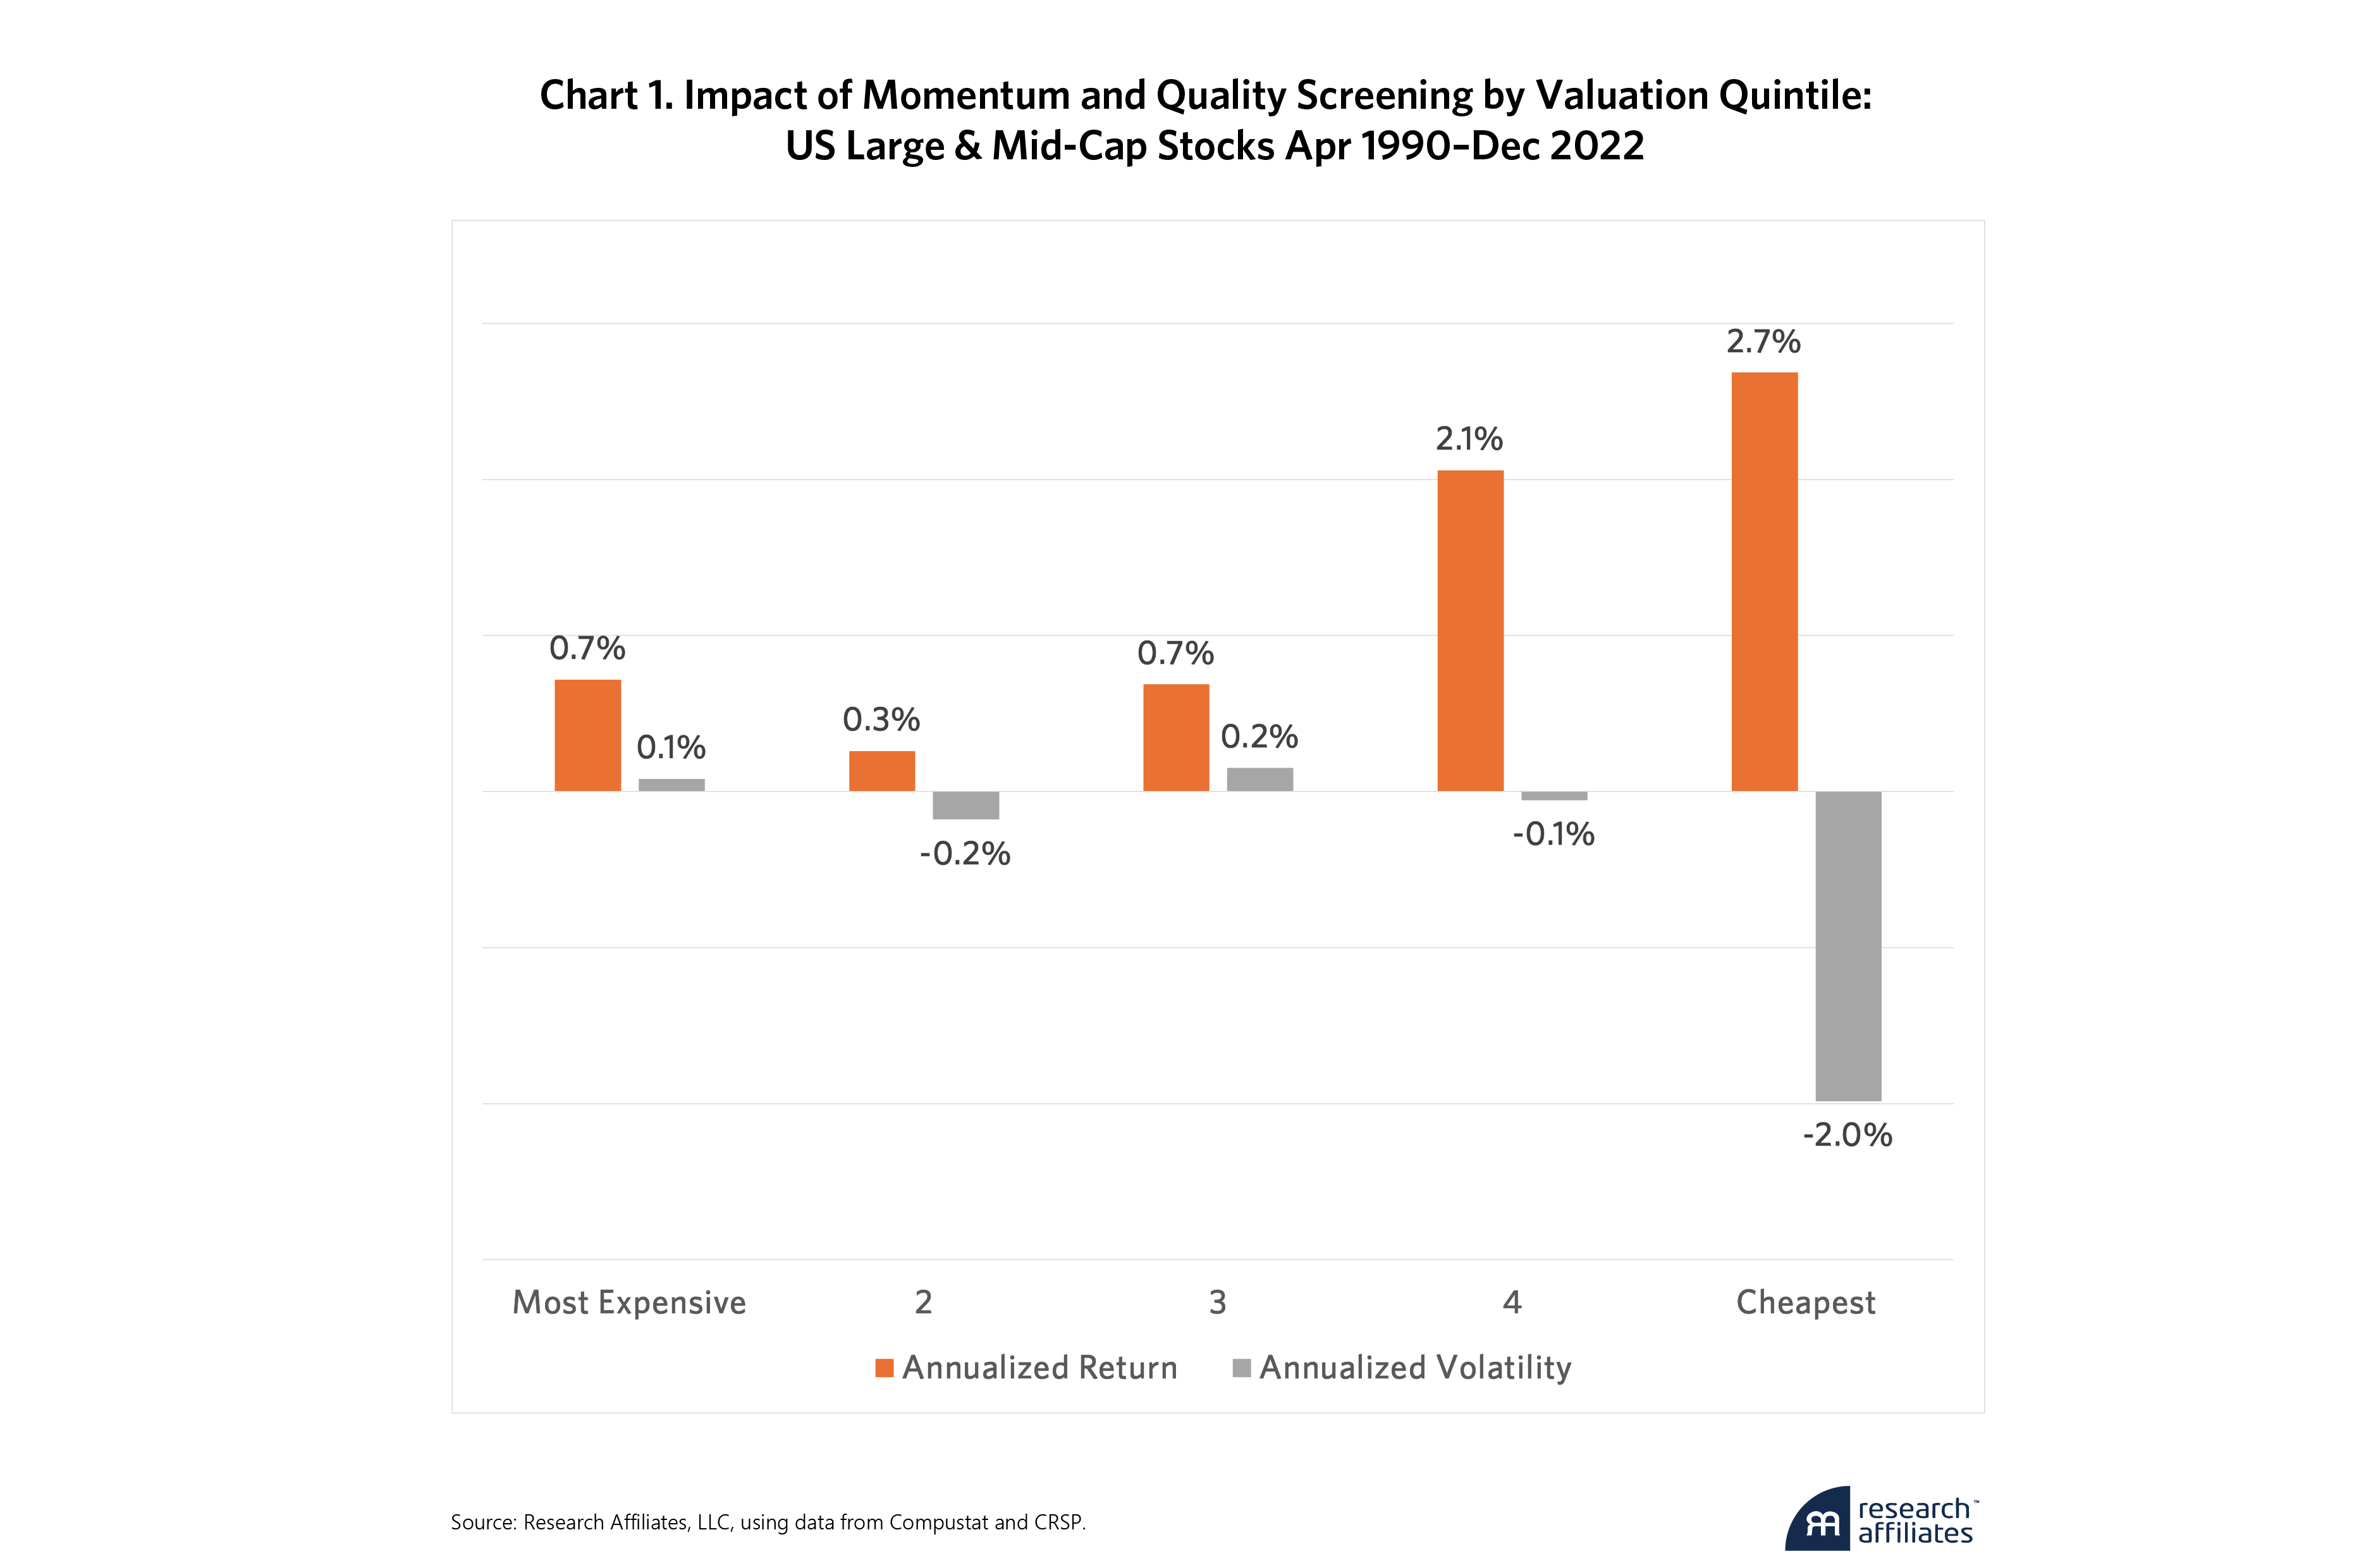
”Chart 1 shows the return and volatility impact of removing undesirable quality or momentum stocks by valuation quintile. More detailed information is presented in Table 4 of the Appendix. From a return perspective, removing unwanted stocks enhances all valuation quintiles, and now, the two most inexpensive quintiles yield a higher return than the middle quintile. From a risk perspective, despite the higher concentration, the volatility of the portfolio declines significantly by 2% for the cheapest group of stocks and remains the same for quintile 4. This shows that holding poor momentum or poor-quality stocks does little to benefit portfolio diversification but rather leads to “diworsification” for value investors.
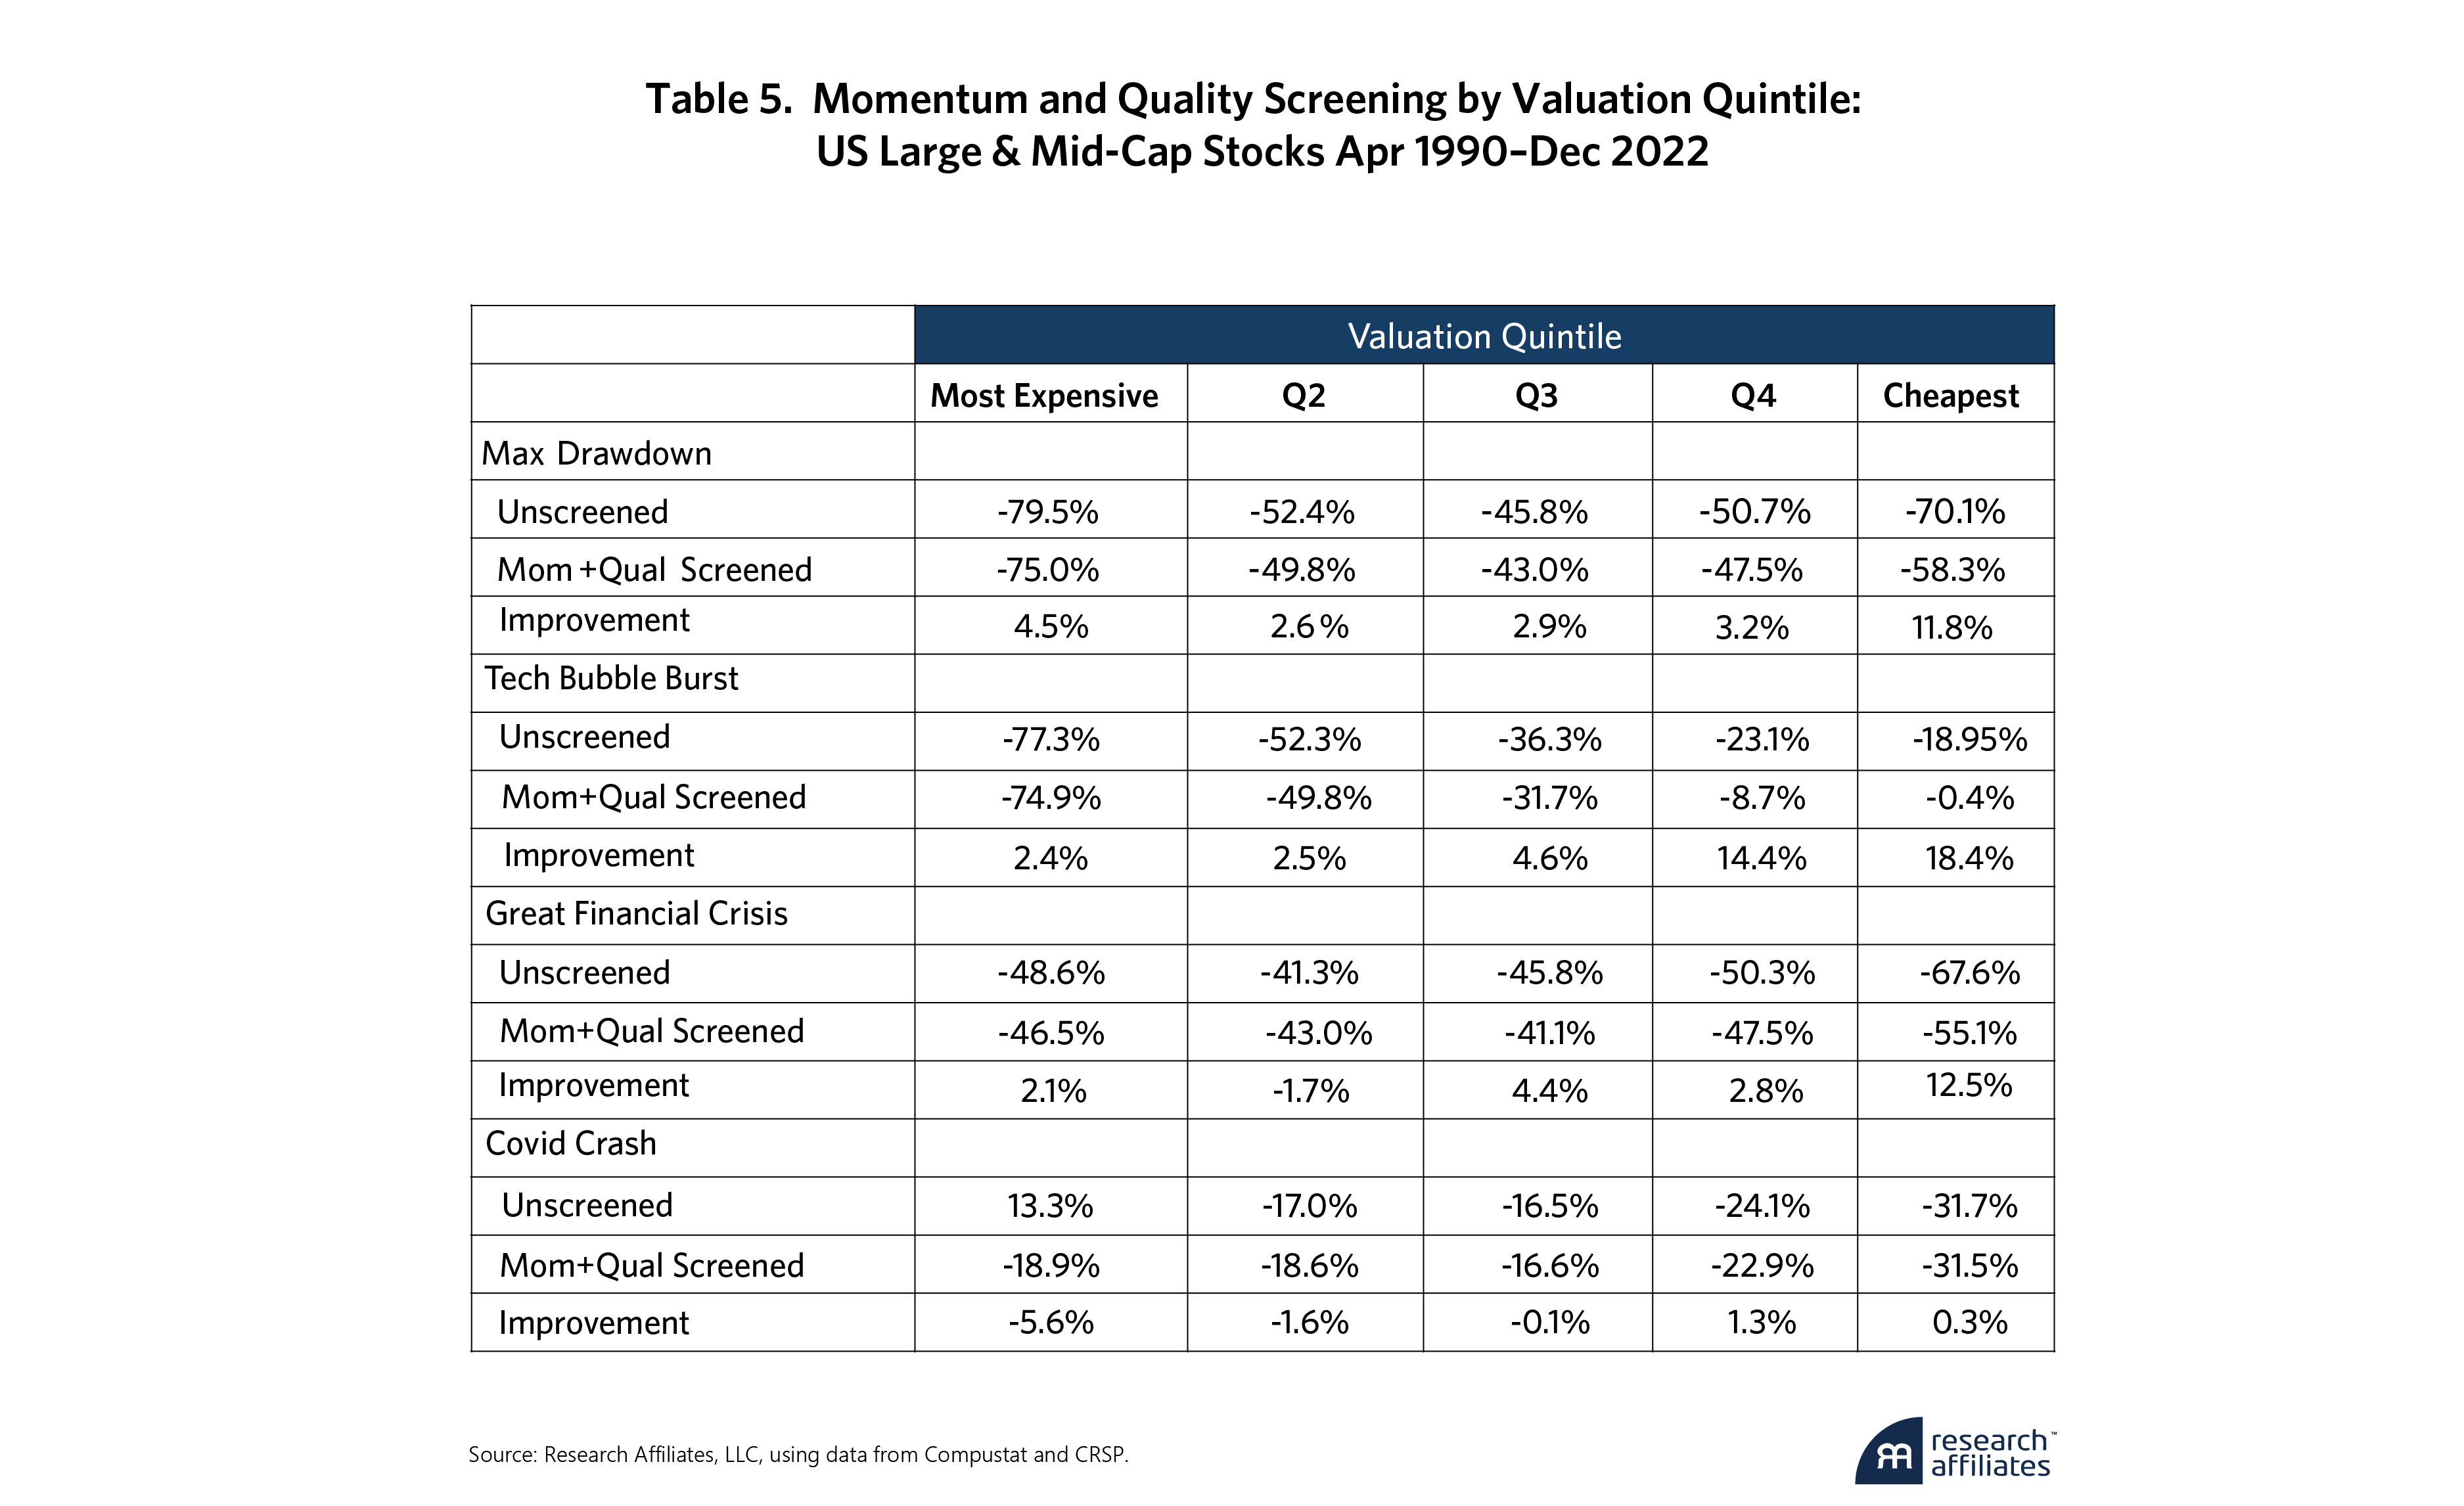
The reduction in risk can also be examined through the lens of drawdowns. We examined the maximum drawdown for each valuation quintile over the entire 32-year measurement period as well as during stressful events including the tech bubble burst (8/31/2000–9/30/2002), the GFC (10/31/2007–2/28/2009) and the COVID crash (1/31/2020–3/31/2020). The maximum drawdown for each quintile may occur at different points in time within the event study window.
Table 5 shows the difference in drawdowns between screened and unscreened portfolios. The most significant benefits overwhelmingly occur in the two cheapest quintiles. The case of the COVID crash stands out because eliminating poor quality and poor momentum stocks did not improve results meaningfully in any valuation quintile. We hypothesize that, in this period, stocks traded not on fundamentals but rather on the market’s perception as to whether the business stood to benefit from the move towards a virtual consumer economy under the pressure of lockdowns. In the most expensive quintiles, removing poor quality and poor momentum stocks worsened results, since those screens may kick out some decent companies that are more likely to rebound after investors’ overreaction to the whole lockdown situation. Among the cheapest stocks, however, there was still a neutral to small benefit during this challenging period.
Conclusion
Valuation gaps are still wide in the US equity market, providing investors an opportune time to enter or rebalance towards value-oriented investments. Assuming the current relative valuations remain constant, we estimate the premium to value in US large and mid-cap stocks could be 2.4%3 per year. In pursuing this opportunity, however, value investors should recognize that merely buying and holding underpriced stocks may not be the optimal strategy. Many underpriced stocks recover handsomely, rewarding patient investors with outsized returns. Others, facing structural distress or mismanagement, remain underpriced or even approach insolvency. These value traps both increase risk and erode the returns to value investors. We estimate that purging the cheapest stocks using momentum and quality signals increases the projected value premium to 5.2% per year using the same relative valuation model.
Please read our disclosures concurrent with this publication: https://www.researchaffiliates.com/legal/disclosures#investment-adviser-disclosure-and-disclaimers.


Appendix

Endnotes
- The Market for “Lemons”: A Lesson for Dividend Investors
- Can Momentum Investing Be Saved? Part IV of Alice in Factorland
- We used the same model as in Arnott, Harvey, Kalesnik, and Linnainmaa (2020) to generate the statistics in this paragraph. The model estimates a structural alpha component to Value to be the intercept of regressing the 12-month change in the relative P/B of the cheapest versus the most expensive stocks against their 12-month return difference.
References
Arnott, Robert D., Campbell R. Harvey, Vitali Kalesnik, and Juhani T. Linnainmaa. 2020. “Reports of Value’s Death May Be Greatly Exaggerated.” Financial Analysts Journal 77:1, 44-67. Available at SSRN: https://ssrn.com/abstract=3488748
Coffinet, Jerome, Adrian Pop, and Muriel Tiesset. 2013. “Monitoring Financial Distress in a High-Stress Financial World: The Role of Option Prices as Bank Risk Metrics.” Journal of Financial Services Research 44: 229–57.
