Rising budget deficits over the past 50 years have crowded out saving, diminished investment, and depressed growth of our standard of living.
If the US adopts European levels of government spending, we will drift toward an anemic European growth rate.
Necessary fiscal reform is economically easy but politically difficult.
While governments responsibly issue debt to fund public investment and dampen the business cycle, the US federal government has borrowed at an increasingly prolific pace over recent decades. History teaches that excessive government debt leads to sovereign debt crises, causing currency devaluation, hyperinflation, financial repression, and outright default.
Create your free account or log in to keep reading.
Register or Log in

With the world’s largest economy and primary reserve currency, we may be less vulnerable than other countries, but we are naïve to assume we’re immune. Even if we avoid a crisis, rising debt and deficits crowd out saving and investment, diminish growth, and depress our prosperity.
An Unsustainable Fiscal Path
From the Global Financial Crisis in 2008 until recent monetary tightening, negative real interest rates made public borrowing seem costless. US government debt held by the public soared from 37% of GDP in 2007 to 78% in 2019. Our recent post-pandemic economic boom was fueled by trillions of dollars in new borrowing. This extraordinary stimulus inflated our debt to nearly 100% of GDP. Now, combined with higher interest rates and slowing growth, our US federal budget deficits are on an unsustainable path.

Both the US Treasury’s Fiscal Service and the Congressional Budget Office project rising debt and deficits. Projections are not forecasts. Projections assume no change to current law, including full expiration of the 2017 tax cuts (much or all of which both Biden and Trump promise to extend), adherence to discretionary spending caps, no recessions, and no emergency spending measures of the sort employed during the Global Financial Crisis and COVID crash. Even with these unrealistically optimistic assumptions, deficits are still projected to rise at an unsustainable rate.
Rise Above the Trees to Perceive the Forest
Most readers are familiar with the business cycle. During recessions, individuals, families, and businesses reduce spending to increase precautionary savings. When people worry about keeping their job, they delay purchases of new cars and TVs and spend less at expensive restaurants. When the economy recovers, incomes rise, precautionary saving declines, and private spending grows.
Meanwhile, in a recession, public spending on unemployment insurance rises, tax receipts decline, and policy makers enact emergency government spending measures to counteract the reduction in private spending. When the economy recovers, emergency fiscal stimulus expires, unemployment insurance payments decline, and tax revenue grows. As a result, private precautionary saving and government budget deficits (negative public saving in national accounting terms) rise together during recessions.
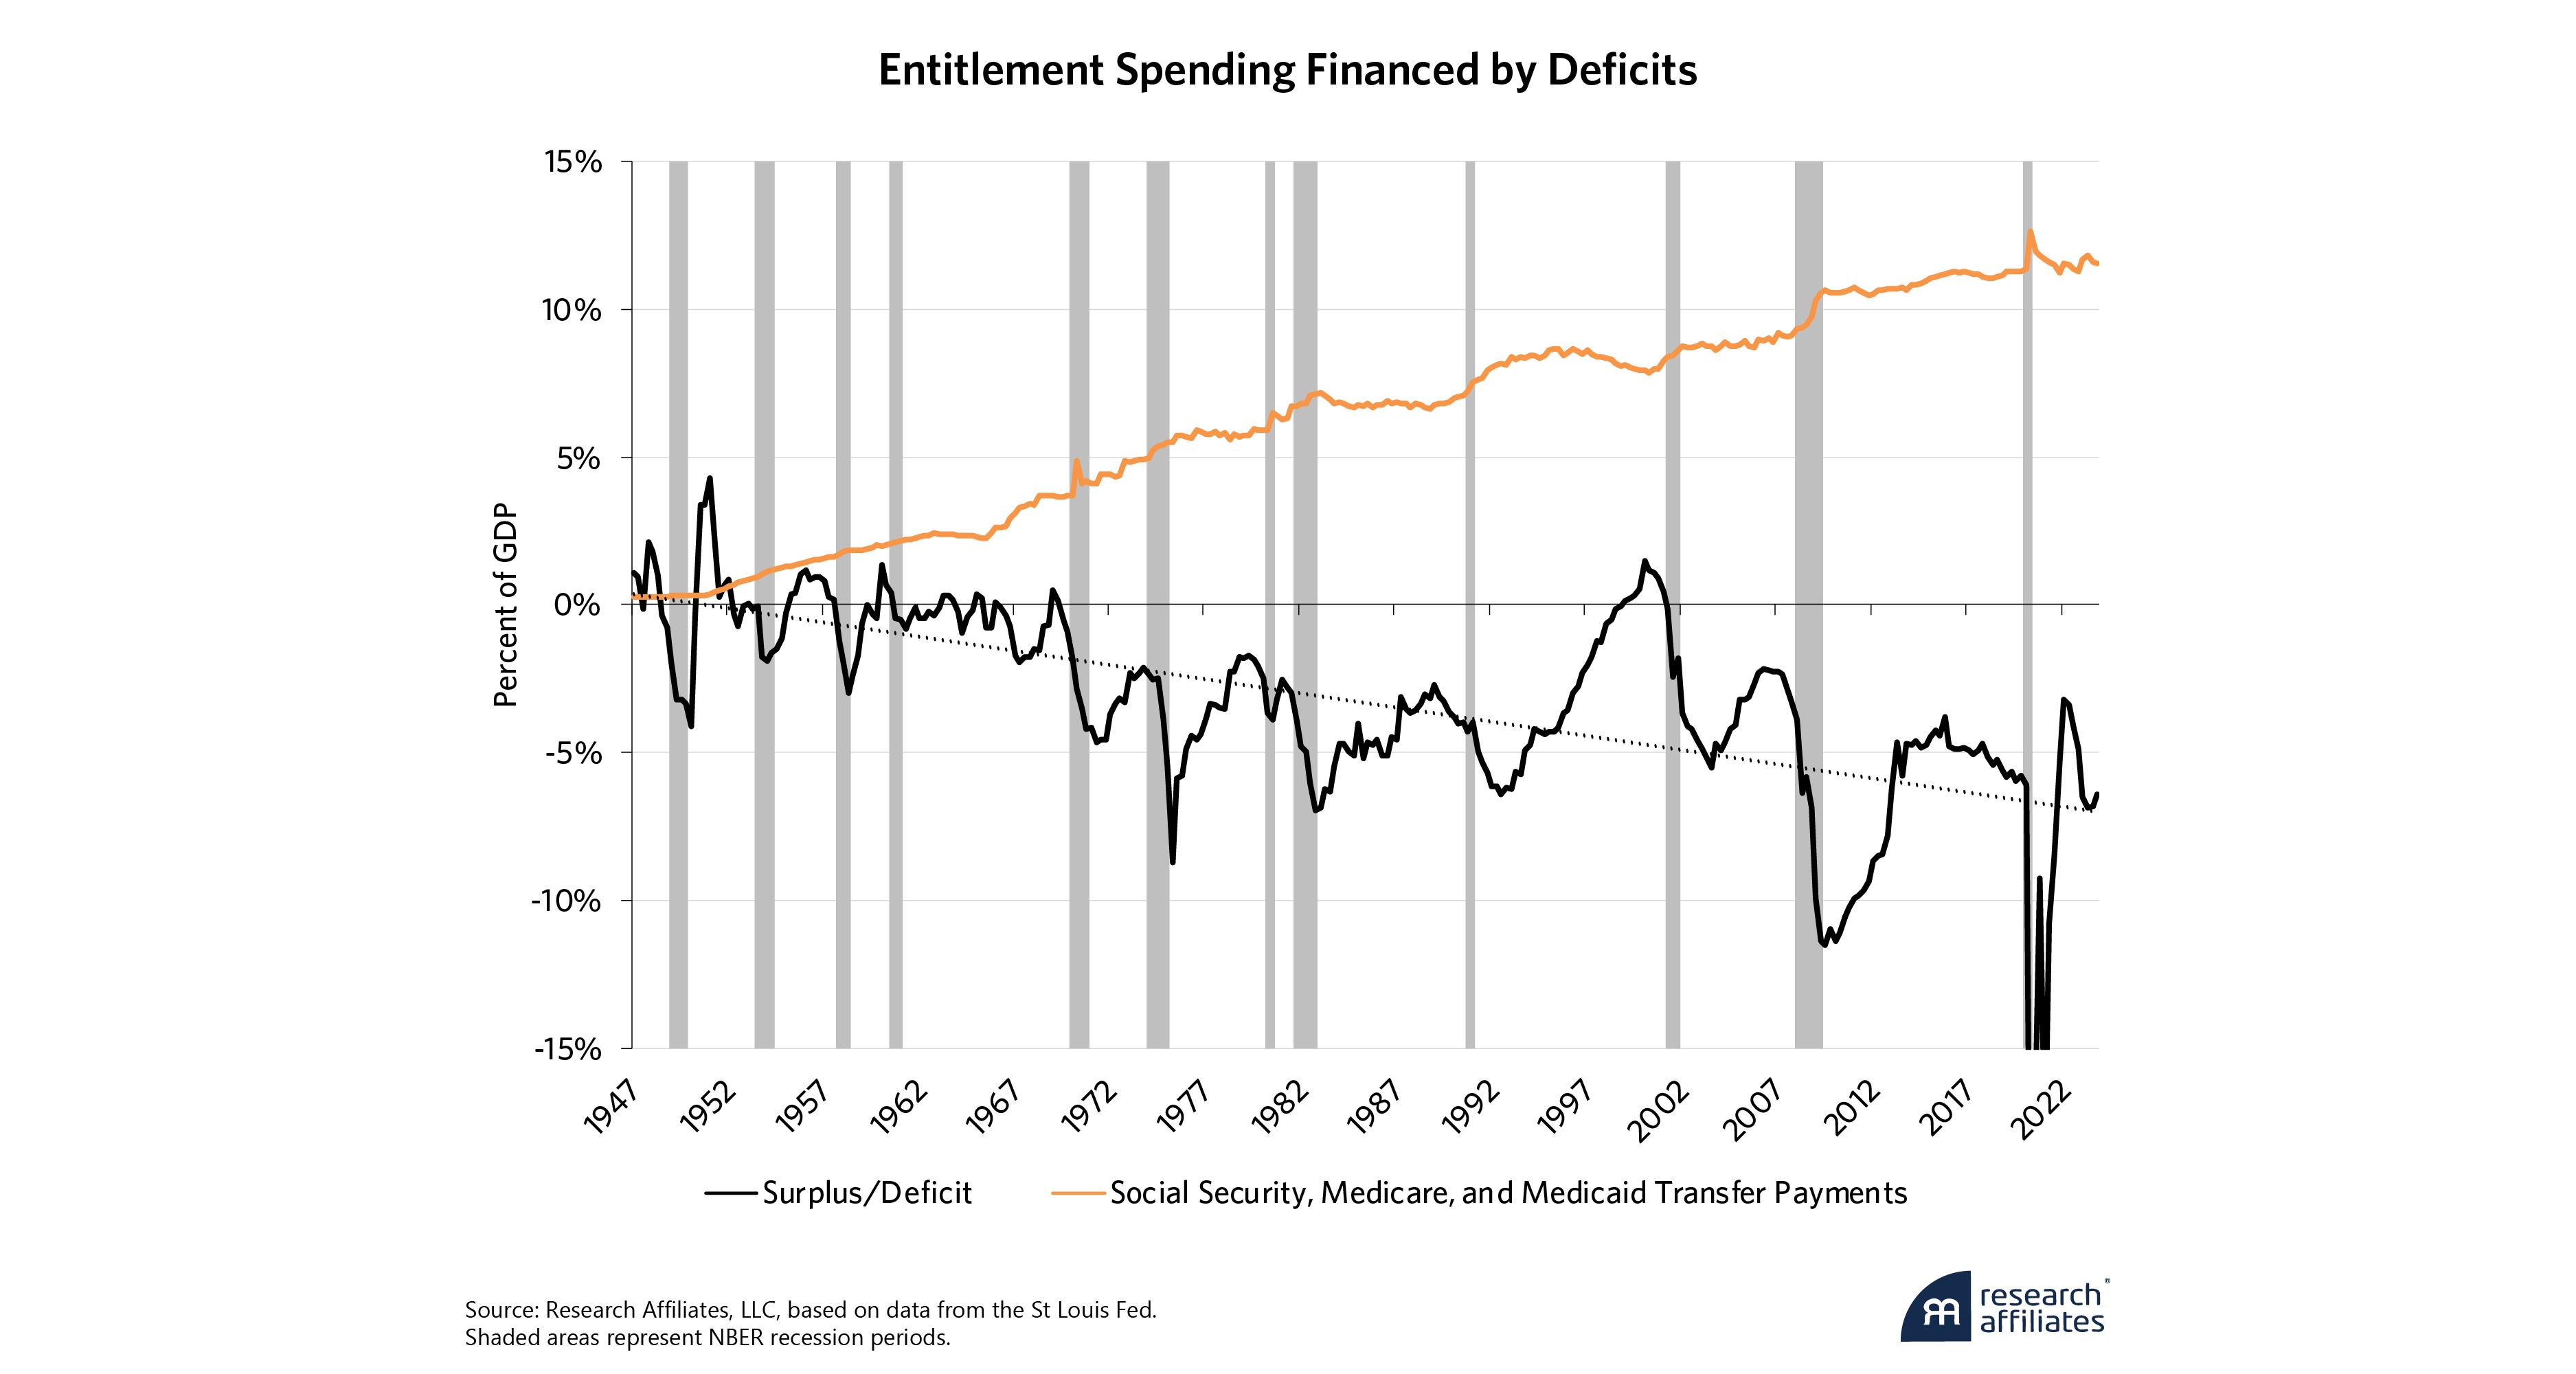
With a publicly provided retirement income, many rationally save less. And when that entitlement spending is financed by public borrowing, negative government saving reduces private saving.
”Recessions thus produce a negative cyclical correlation between public and private saving; government spending of newly borrowed money fills the hole in aggregate demand created by private sector precautionary saving. This process is standard Keynesianism – but only by half. We haven’t followed the other part of Keynes’ policy prescription that requires running budget surpluses to paydown public debt during economic expansions, such as now. This failure is causing the soaring debt and unsustainable deficits discussed above.
While public and private saving are negatively correlated across the business cycle, they are positively correlated over the long run. The reason is clear. With a publicly provided retirement income, many rationally save less. And when that entitlement spending is financed by public borrowing, negative government saving reduces private saving.
Similarly, recessions cause a negative cyclical correlation between economic growth and labor productivity. Businesses reduce labor expense to increase precautionary savings during recessions. They fire their least productive workers and try to maintain output as best they can with a smaller payroll. As a result, employment declines while labor productivity rises during recessions. Labor productivity then falls during recoveries as less productive members of the labor force are hired back. Labor productivity and economic growth are thus negatively correlated across the business cycle.
Over the long run, however, productivity growth is not just positively correlated with economic growth. It is a primary source of that growth, along with growth of our labor force. With a stable population, labor productivity becomes our only source of real economic growth.
Deficits Crowd Out Saving and Depress Investment
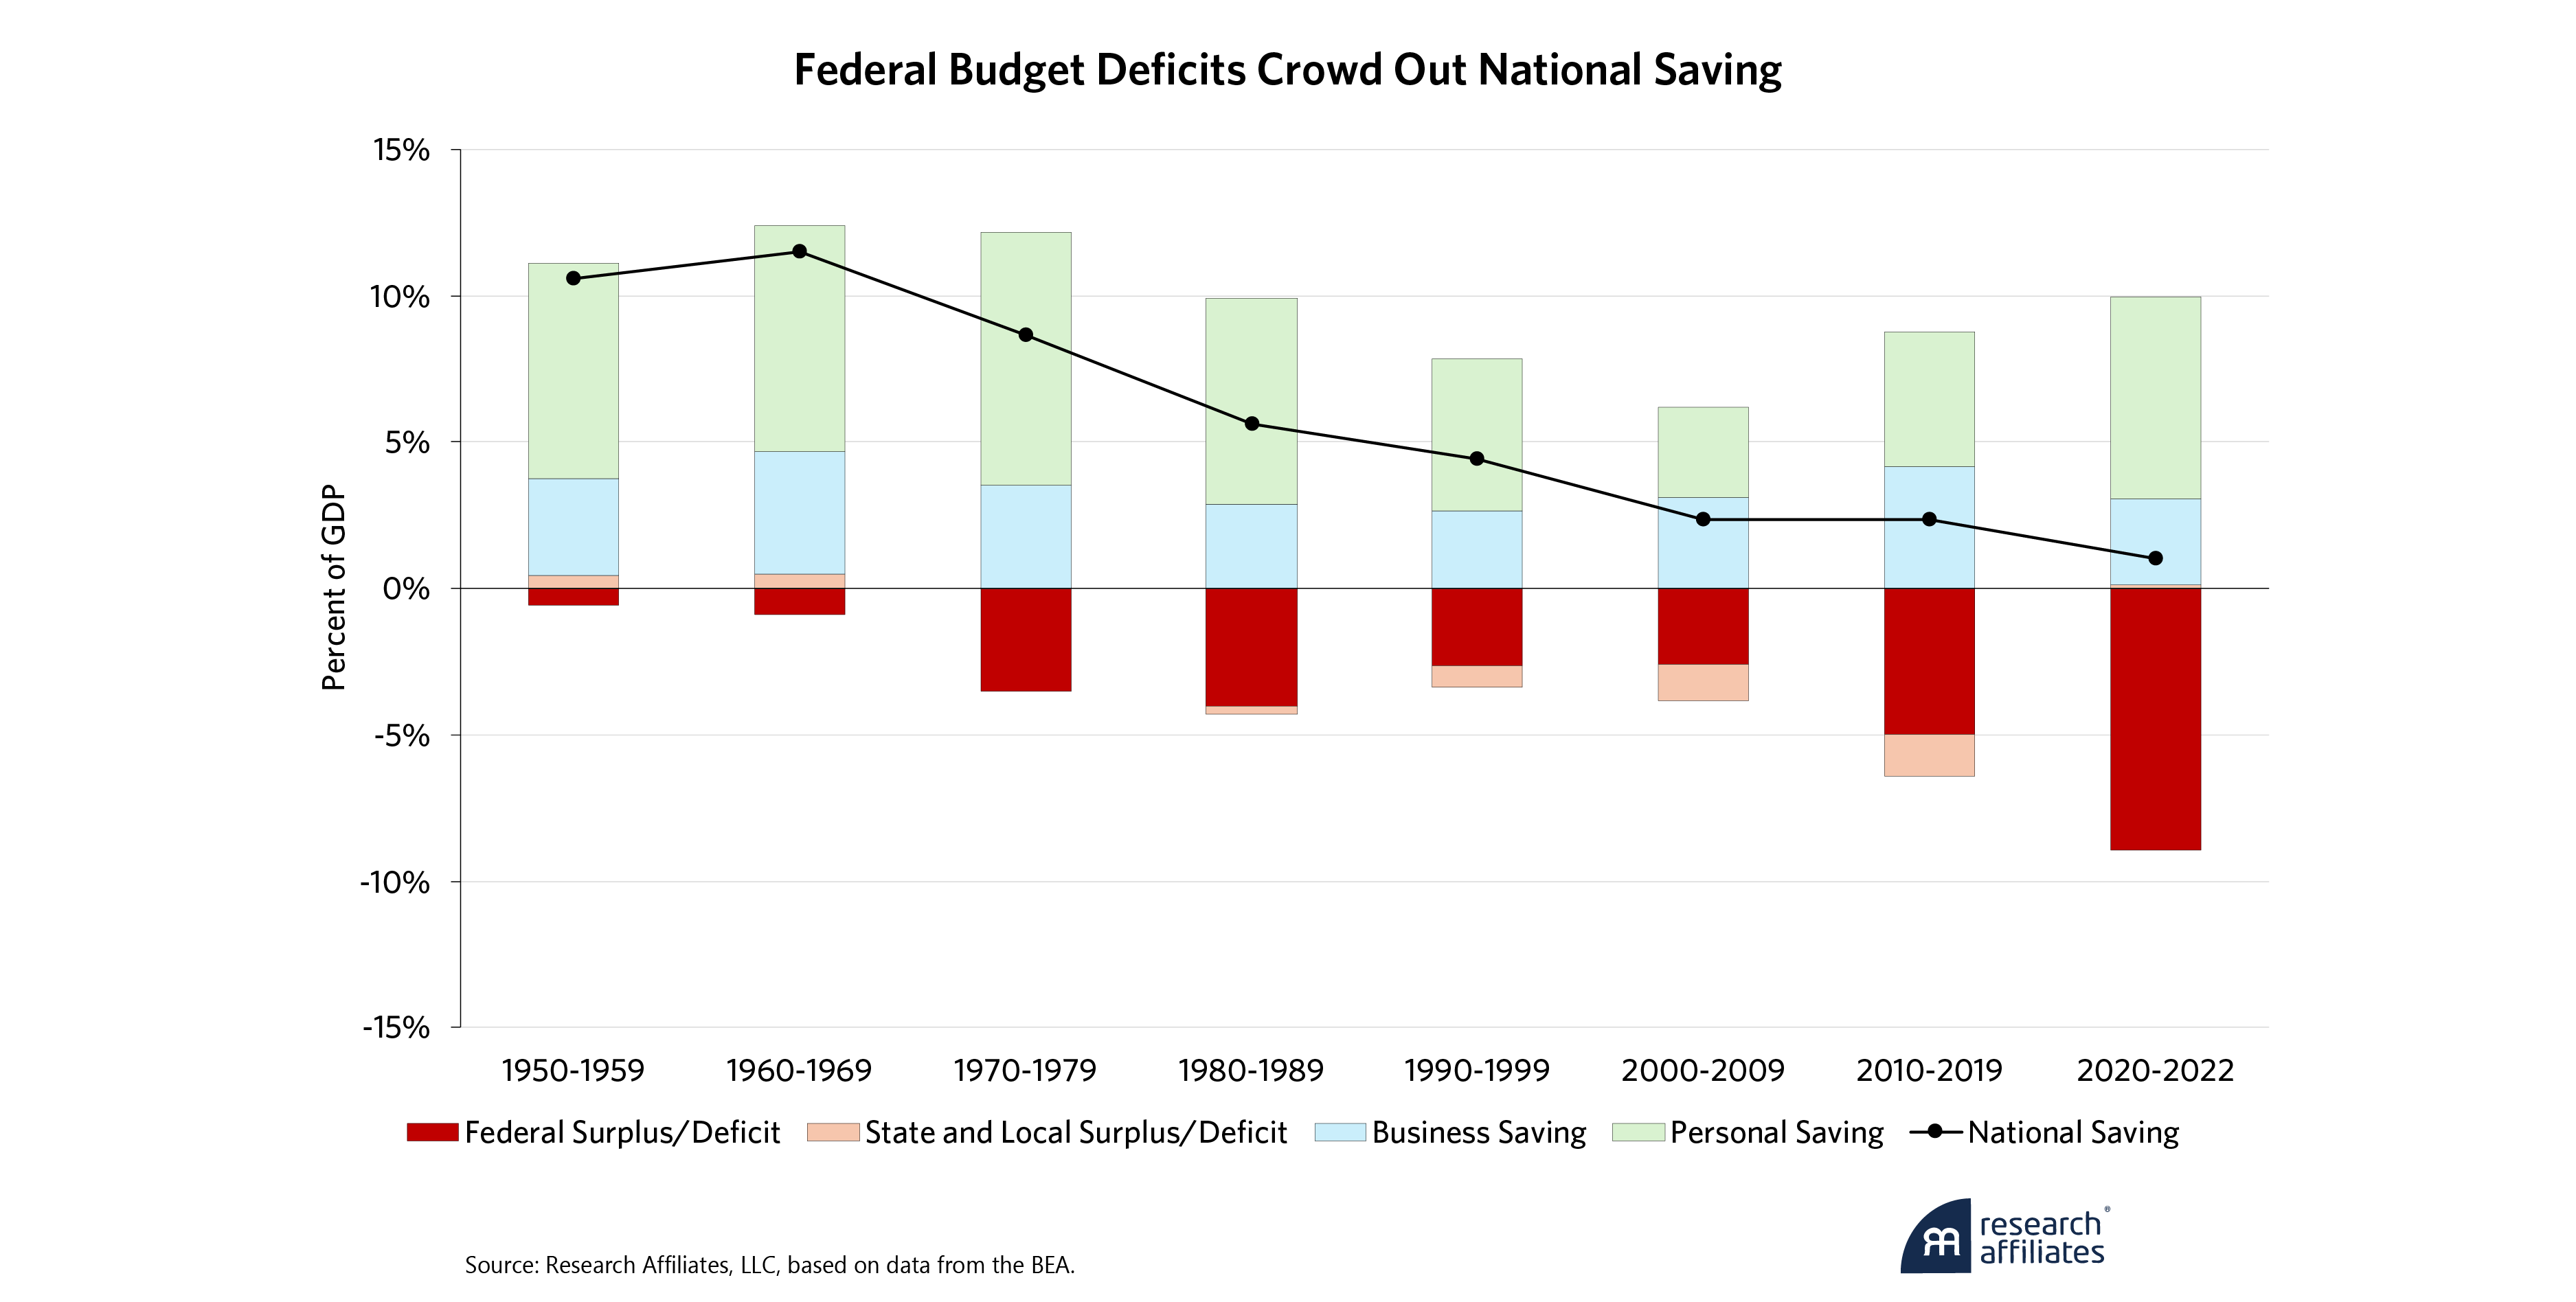
As fiscal policy evolved from secularly balanced budgets in the 1950s and 1960s to persistent deficits to finance rising entitlement spending in the 21st century, private saving declined from 10%-12% of GDP to less than 8%, national saving (the sum of public and private saving) declined to only 1% of GDP, and domestic investment declined from 11% of GDP to less than 5%.
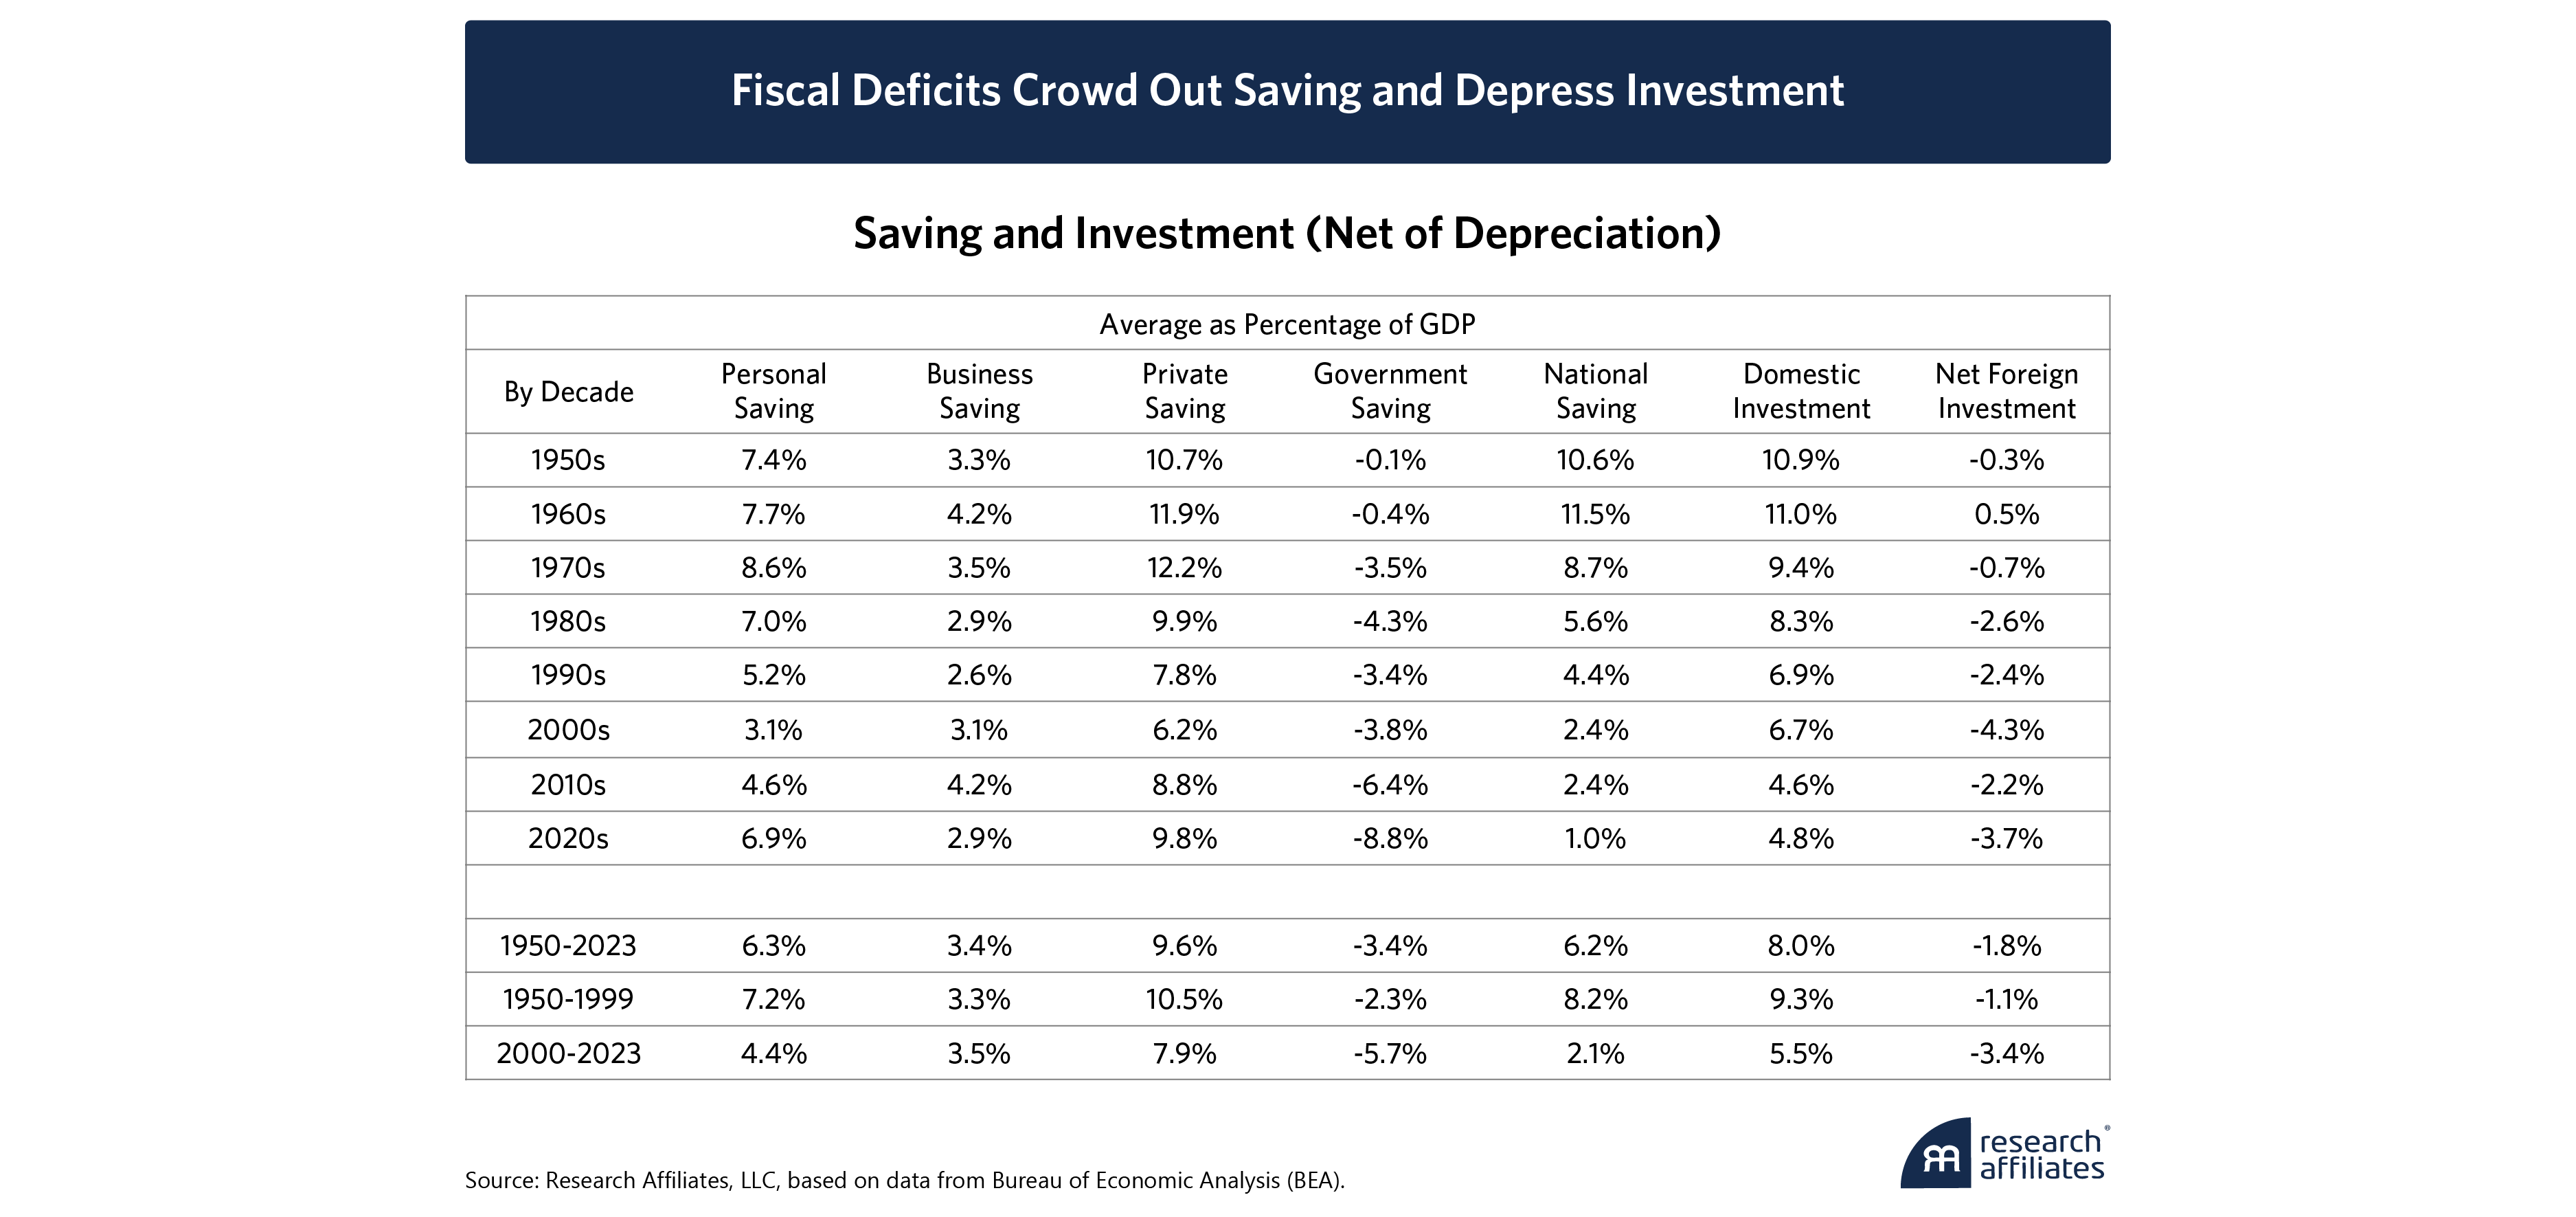
Why have US national saving and domestic investment declined over the decades? From a national accounting perspective, the decline was caused by increasing federal budget deficits. Government saving has dropped from approximately zero (balanced budgets) in the 1950s and 1960s to nearly negative 10% of GDP in recent years. Absent fiscal reform, projected deficits will drag national saving deeply negative!
Recent US national saving has been insufficient even to replace consumption of capital – to maintain houses and factories, repair roads and bridges, replace obsolete machinery and information technology, and so forth. Fortunately, the scale of the US economy, innovation of our private sector, and strength of our institutions attract foreign investment.
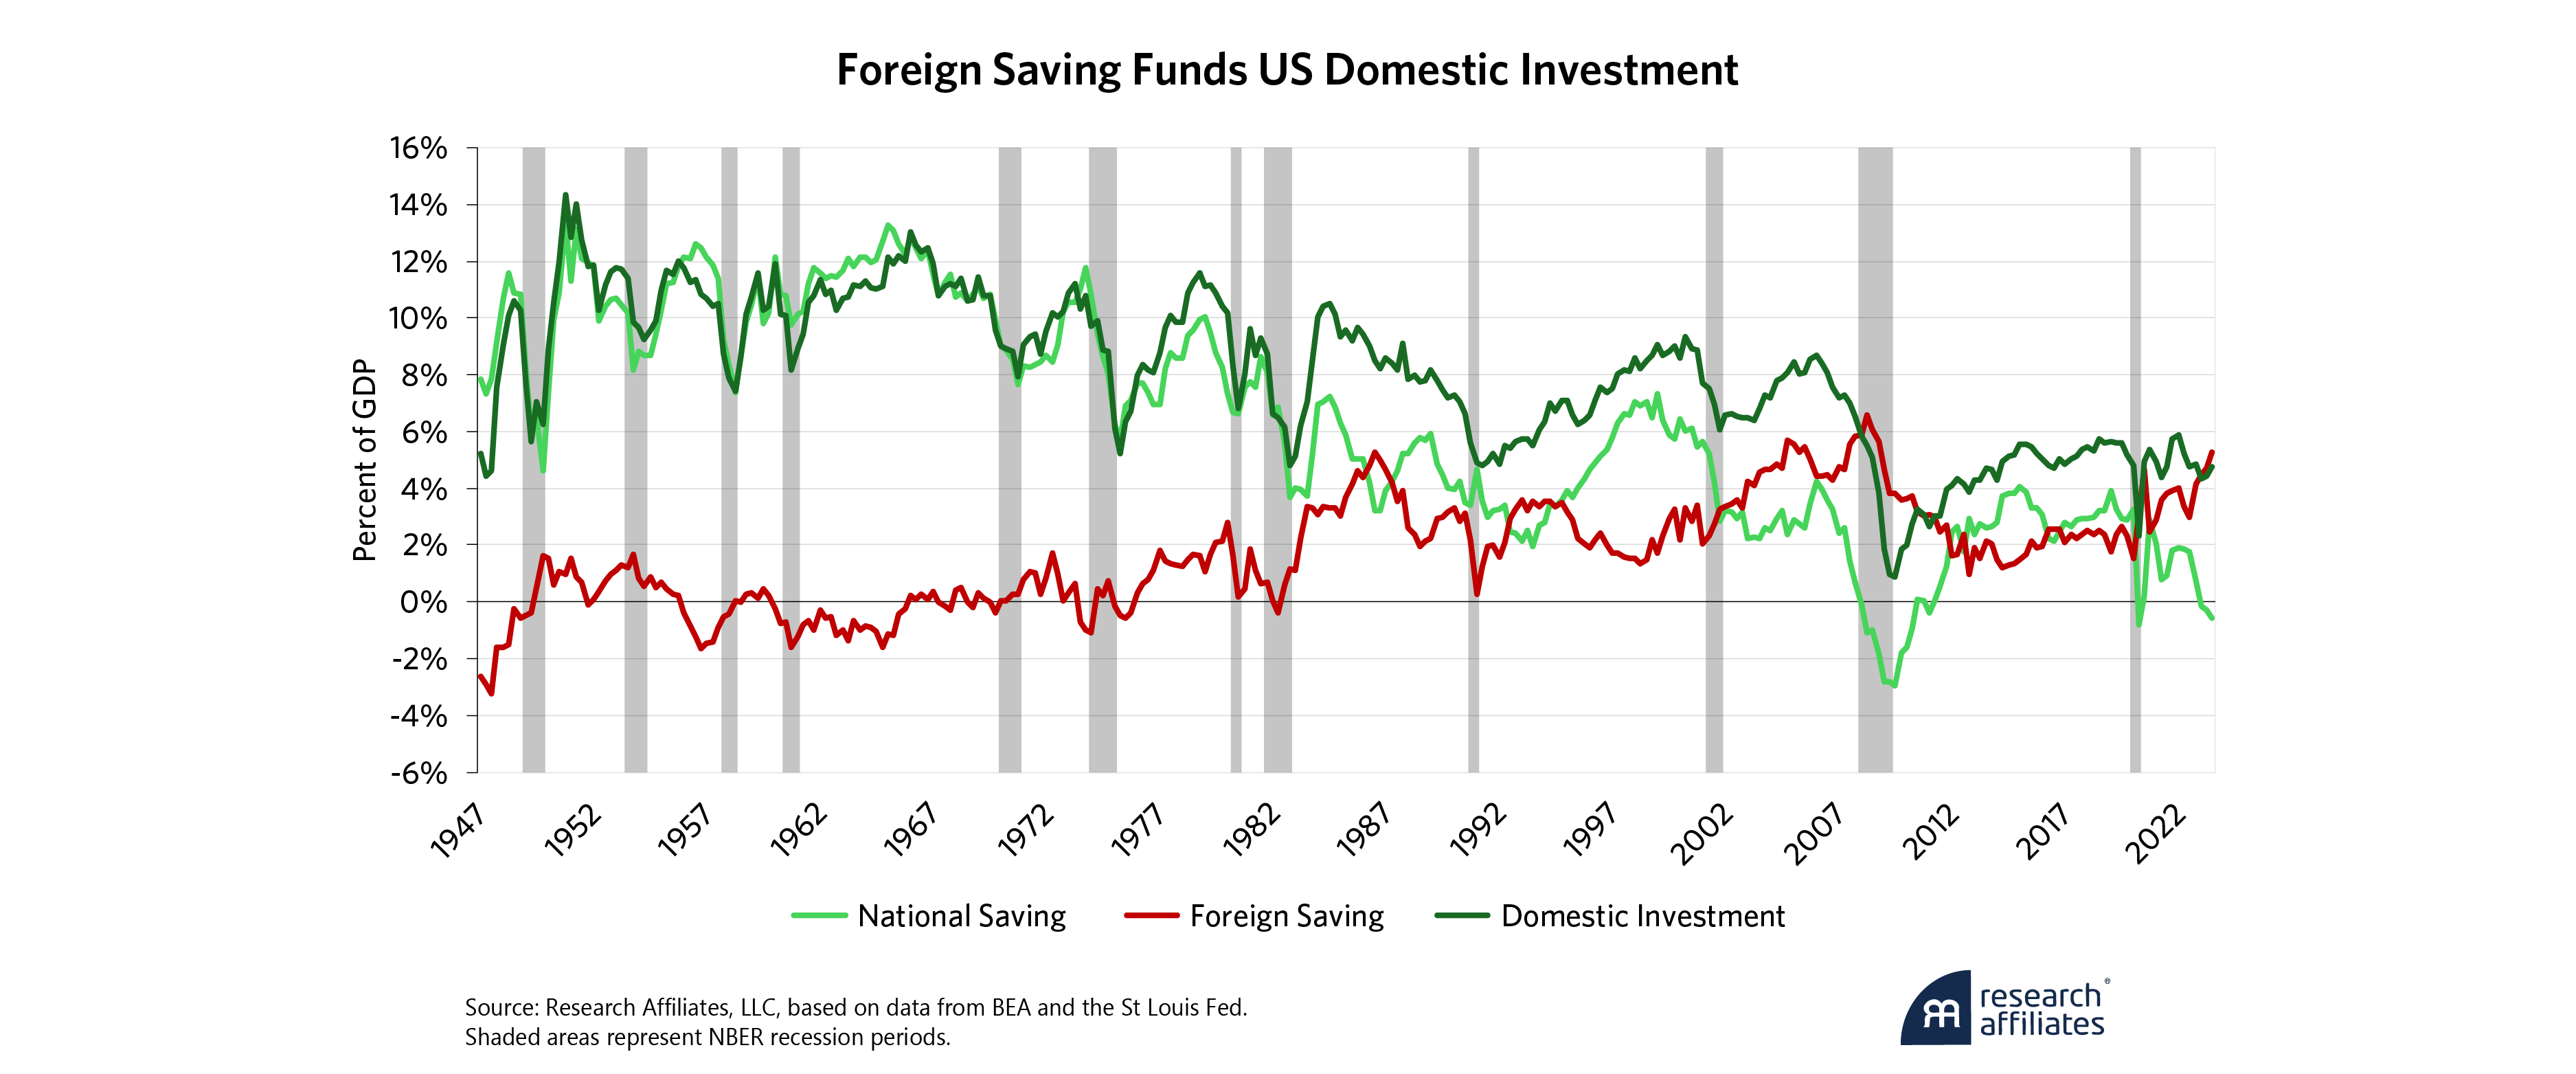
When a country’s national saving is less than its domestic investment, foreign saving must fill the gap. Foreign saving, which approximately equals the capital account, is the complement of net foreign investment. In recent years, investment of foreign saving funded more than all US domestic investment.
Lower Capital Investment Depresses Our Prosperity
Real GDP growth in the US has halved over the past 60 to 70 years. Real GDP grew by more than 4% in the 1950s and 1960s, by over 3% from the 1970s through the 1990s, and then slowed to 2% during the 21st century.
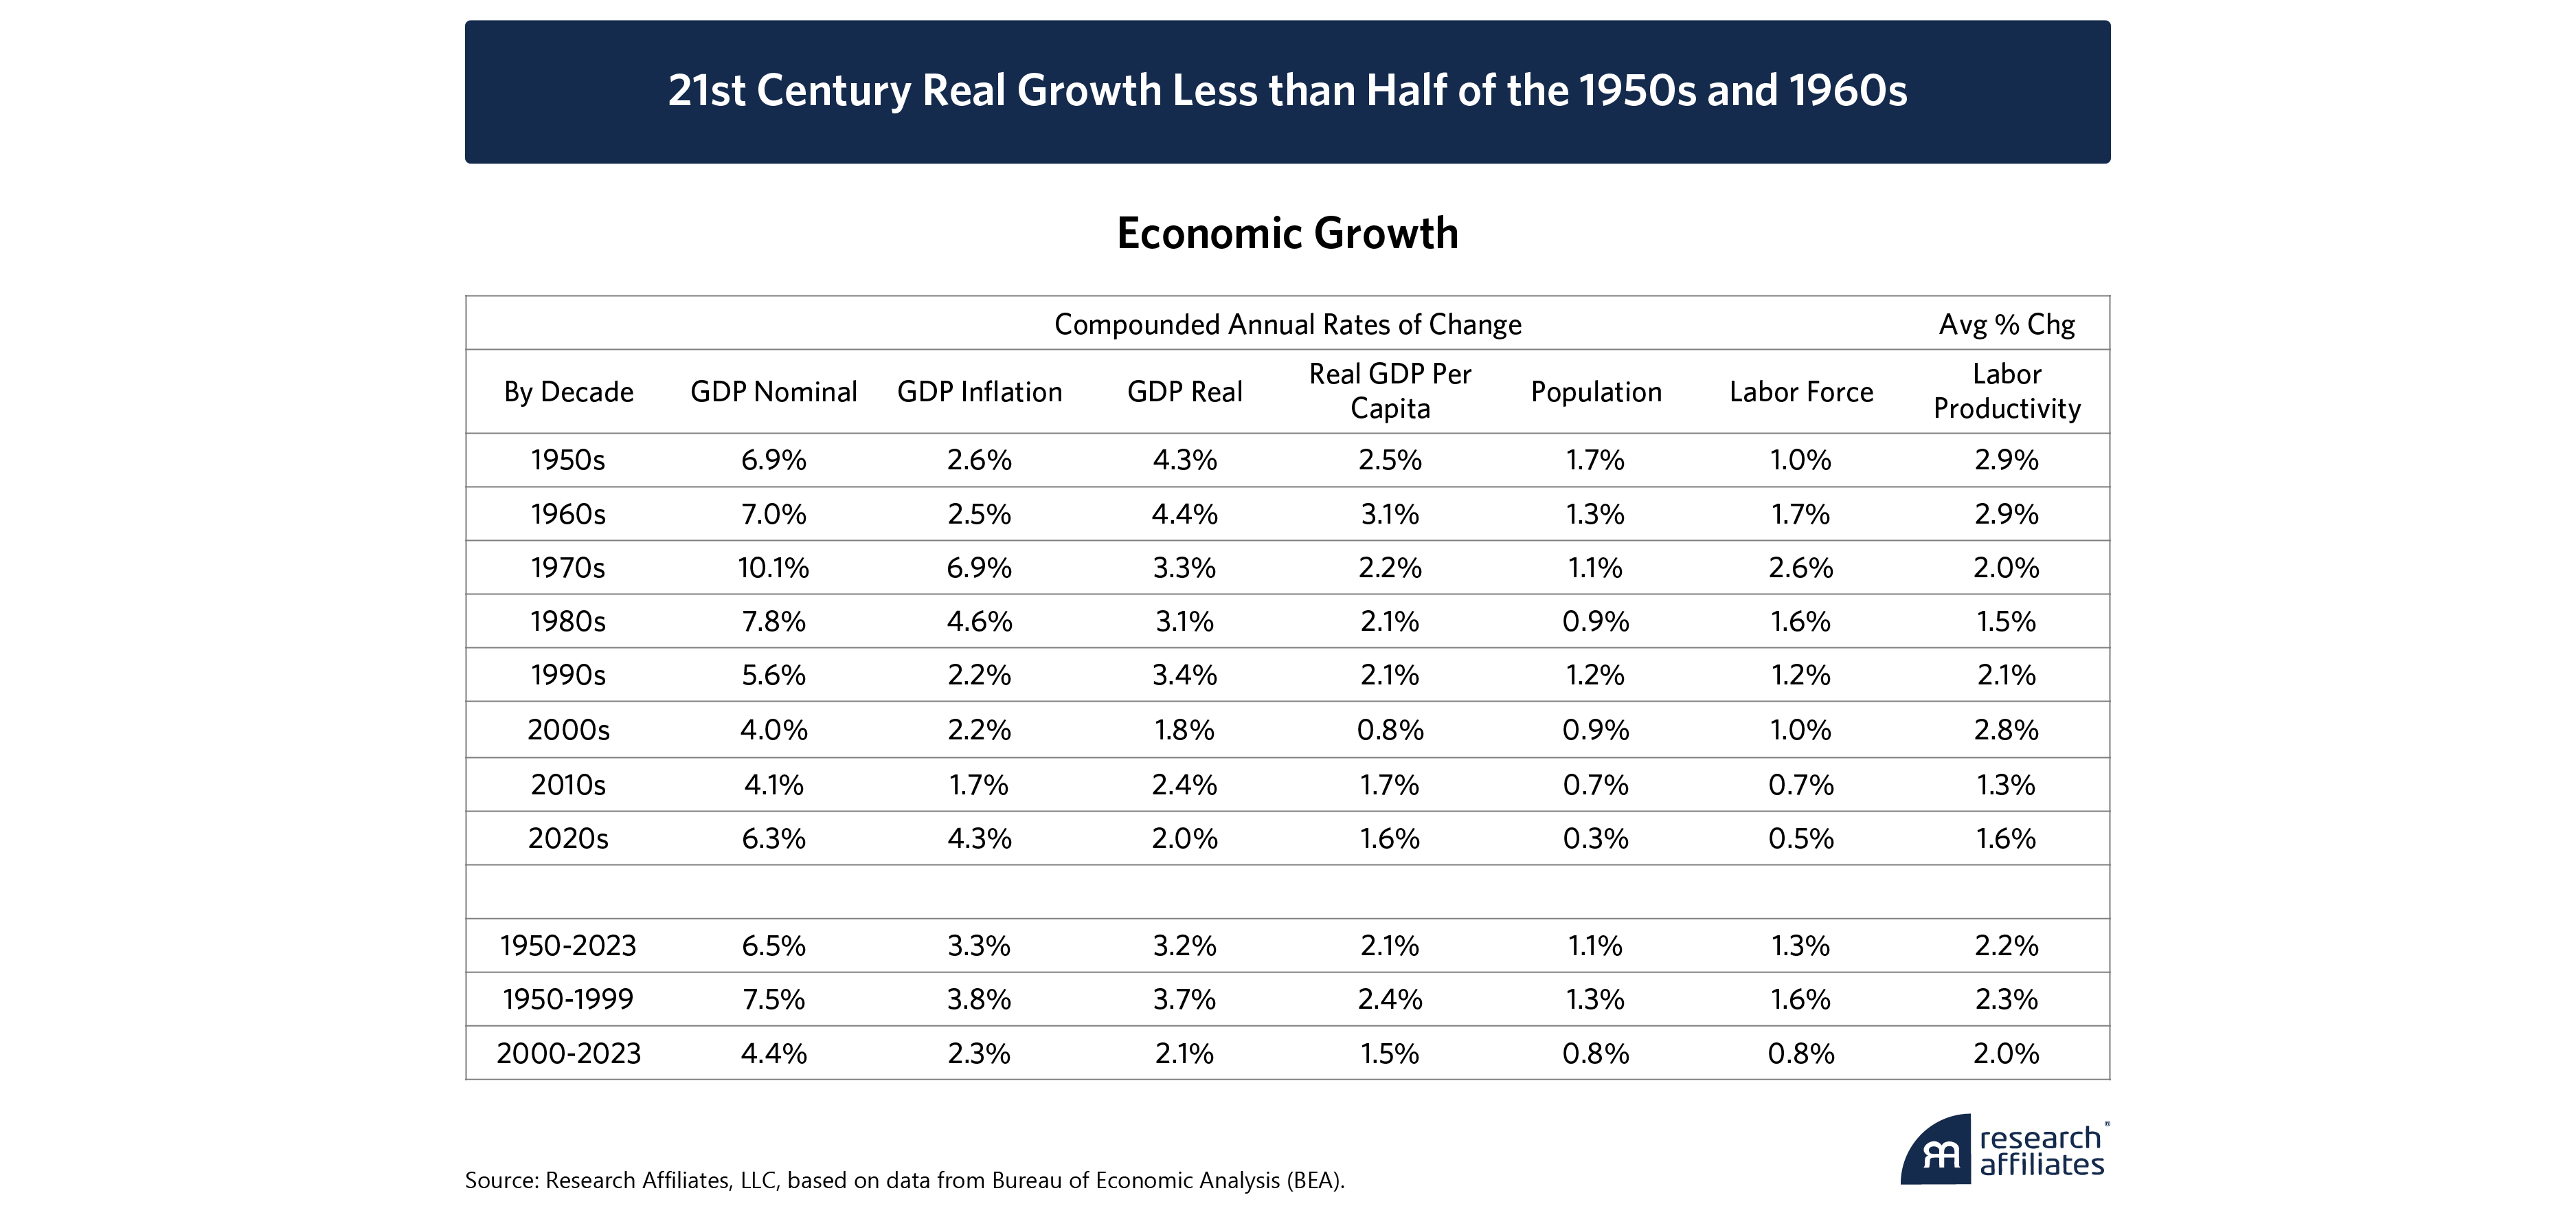
Part of this slowing of growth is due to demography – slowing growth of the US population and labor force. As the baby boom generation reached working age in the 1970s, growth of the US labor force peaked at an annual average of 2.6% in that decade. During the second half of the twentieth century, annual labor force growth averaged 1.6%. So far in the 21st century, with a declining fertility rate and boomers retiring, annual growth in our population and labor force has slowed to 0.8%.
The other part of the decline in growth is attributable to slowing growth of labor productivity. Growth of our capital stock makes workers more productive. Construction workers build houses and bridges more quickly with power tools than with hand tools. Factory workers assemble automobiles and computers more efficiently with machine tools and industrial robots. Semiconductor chips are fabricated more profitably in automated foundries. Knowledge workers produce more output per hour using computers with internet access, cloud storage, and AI tools than with libraries, typewriters, and telephones. Producing, maintaining, and replacing power tools, industrial robots, computers, microchip foundries, cloud storage, and AI tools requires investment.
Because investment dropped by more than half, from 11% of GDP in the 1950s and 1960s to below 5% in the 2010s and 2020s, real growth per person more than halved from 3% in the 1950s and 1960s to less than 1.5% in the 21st century to date.
”The post-WWII economic boom produced peaks in real per capita GDP growth above 5% for a few years and an average annual growth rate of 3% in the 1950s and 1960s. Per capita growth then dropped to 2.2% during the turbulent inflationary years of the 1970s and averaged just over 2% for the rest of the twentieth century.
Growth was sluggish during the early years of this century following the bursting of the 1990s dotcom tech bubble. Growth turned deeply negative during the Global Financial Crisis and slowly recovered to a 1.7% pace in the 2010s. Recently, growth plunged with the COVID shutdown of supply and then spiked up as the economy reopened, and supply returned. During the 21st century to date, annualized per capita growth has been only 1.3%, which is less than half the growth of the 1950s and 1960s.
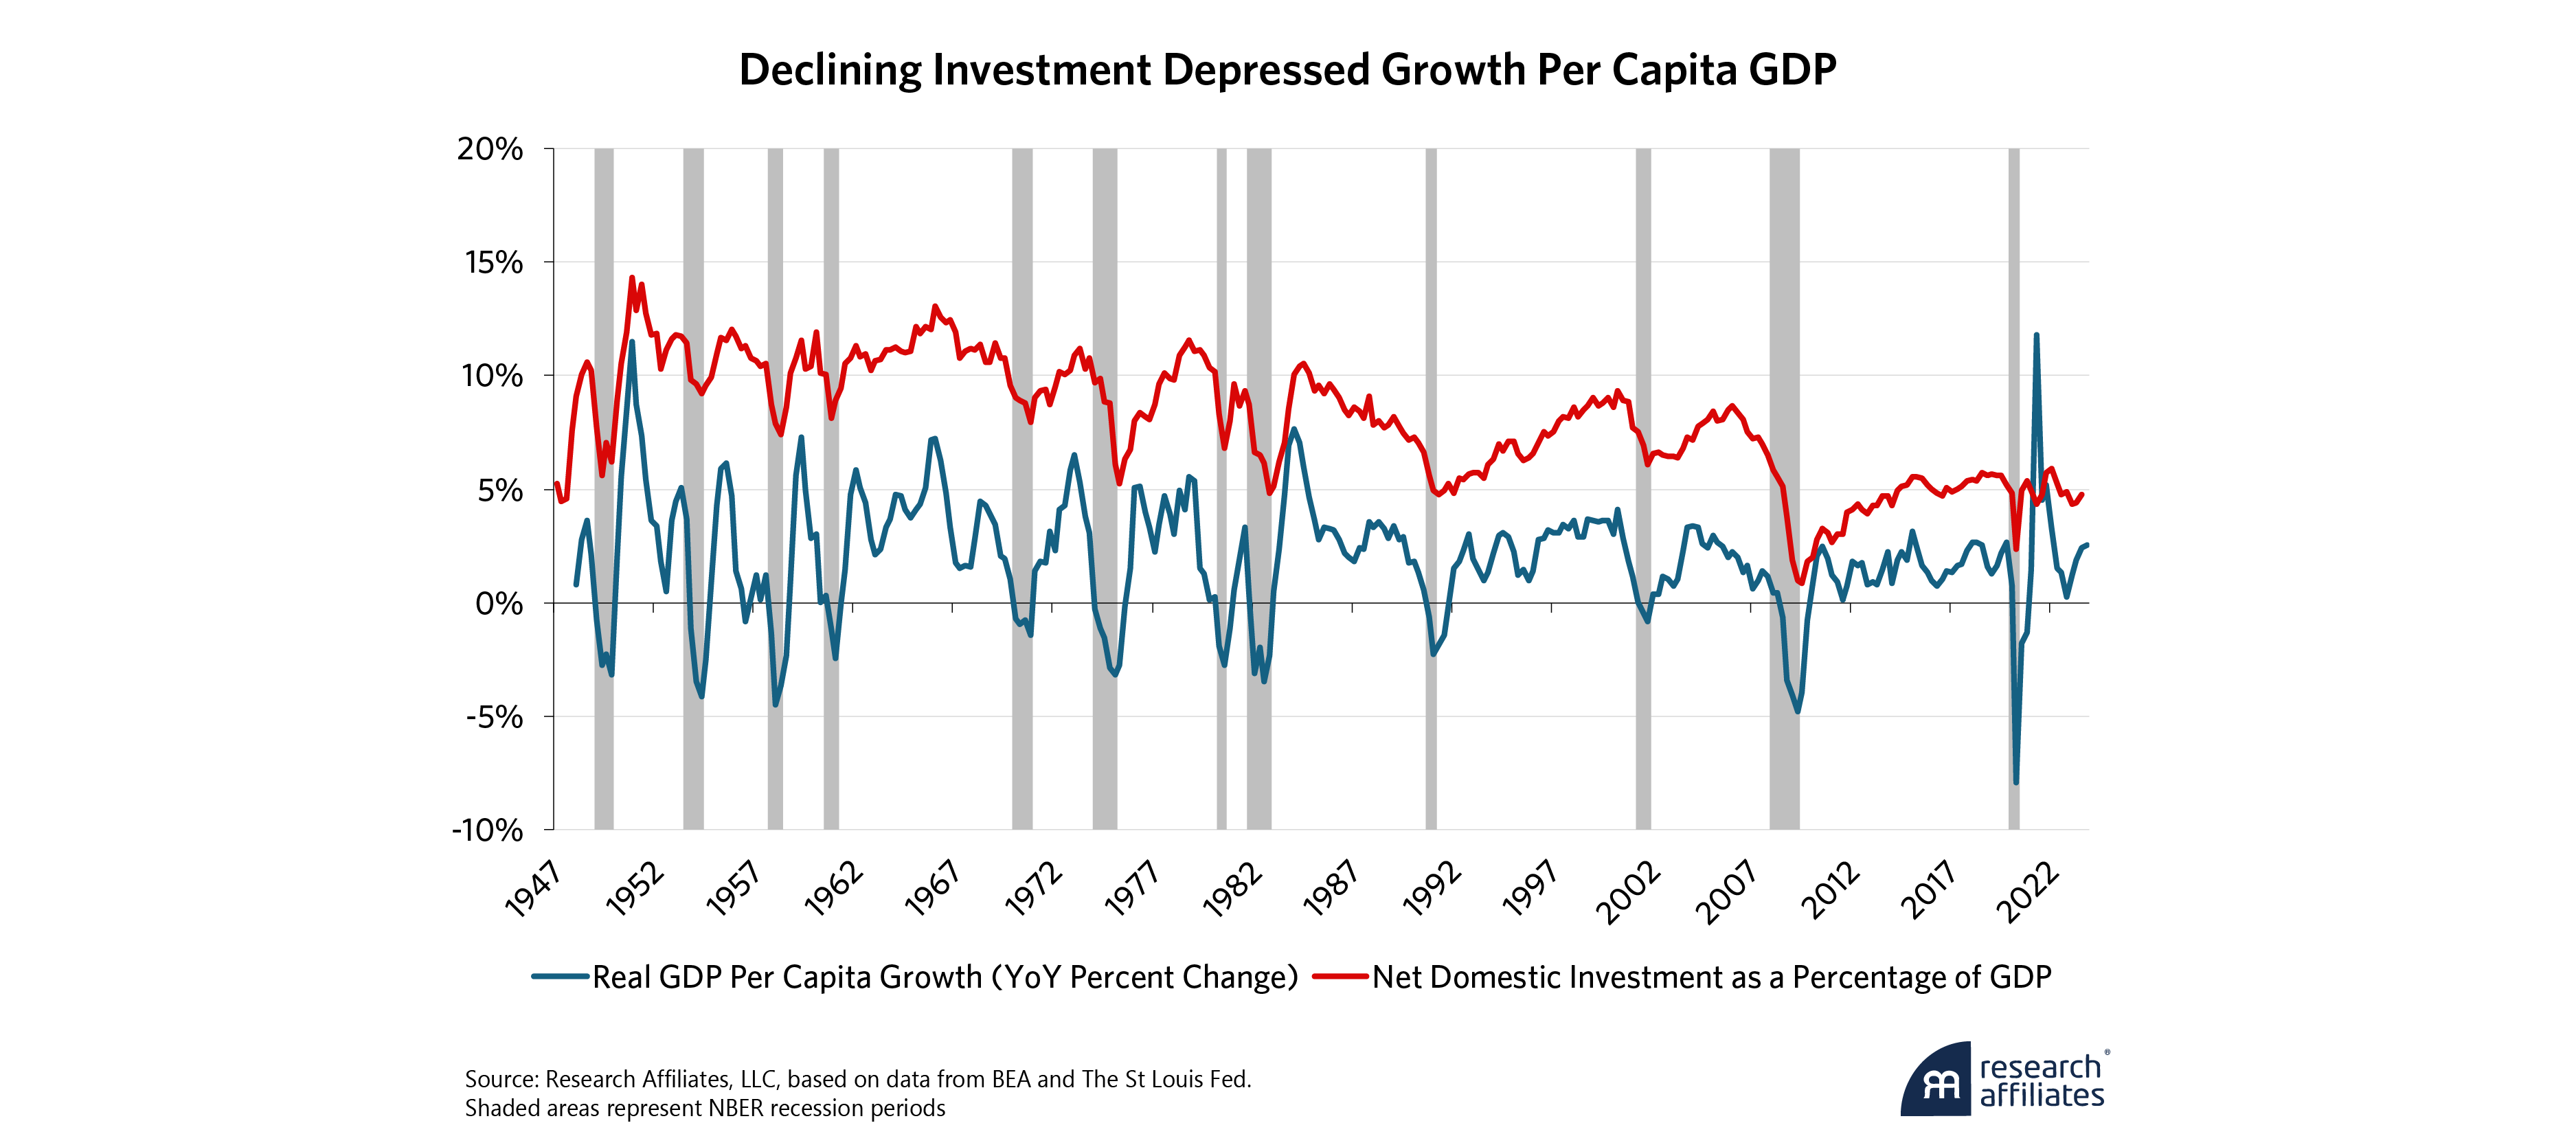
Given the strong theoretical and empirical links of saving with investment and investment with productivity, we may confidently assume the decline in investment caused much if not all the decline in real growth per person over recent decades. In approximate terms, because investment dropped by more than half, from 11% of GDP in the 1950s and 1960s to below 5% in the 2010s and 2020s, real growth per person more than halved from 3% in the 1950s and 1960s to less than 1.5% in the 21st century to date. This historical data supports our interpretation that secularly rising federal budget deficits have crowded out national saving, diminished domestic investment, and depressed growth of our standard of living.
Government Spending Slows Growth
As economies develop, the scale of government increases. Governments of developed countries spend more on infrastructure, education, health and welfare, and defense than do less developed countries. We feel blessed to reside in the US.
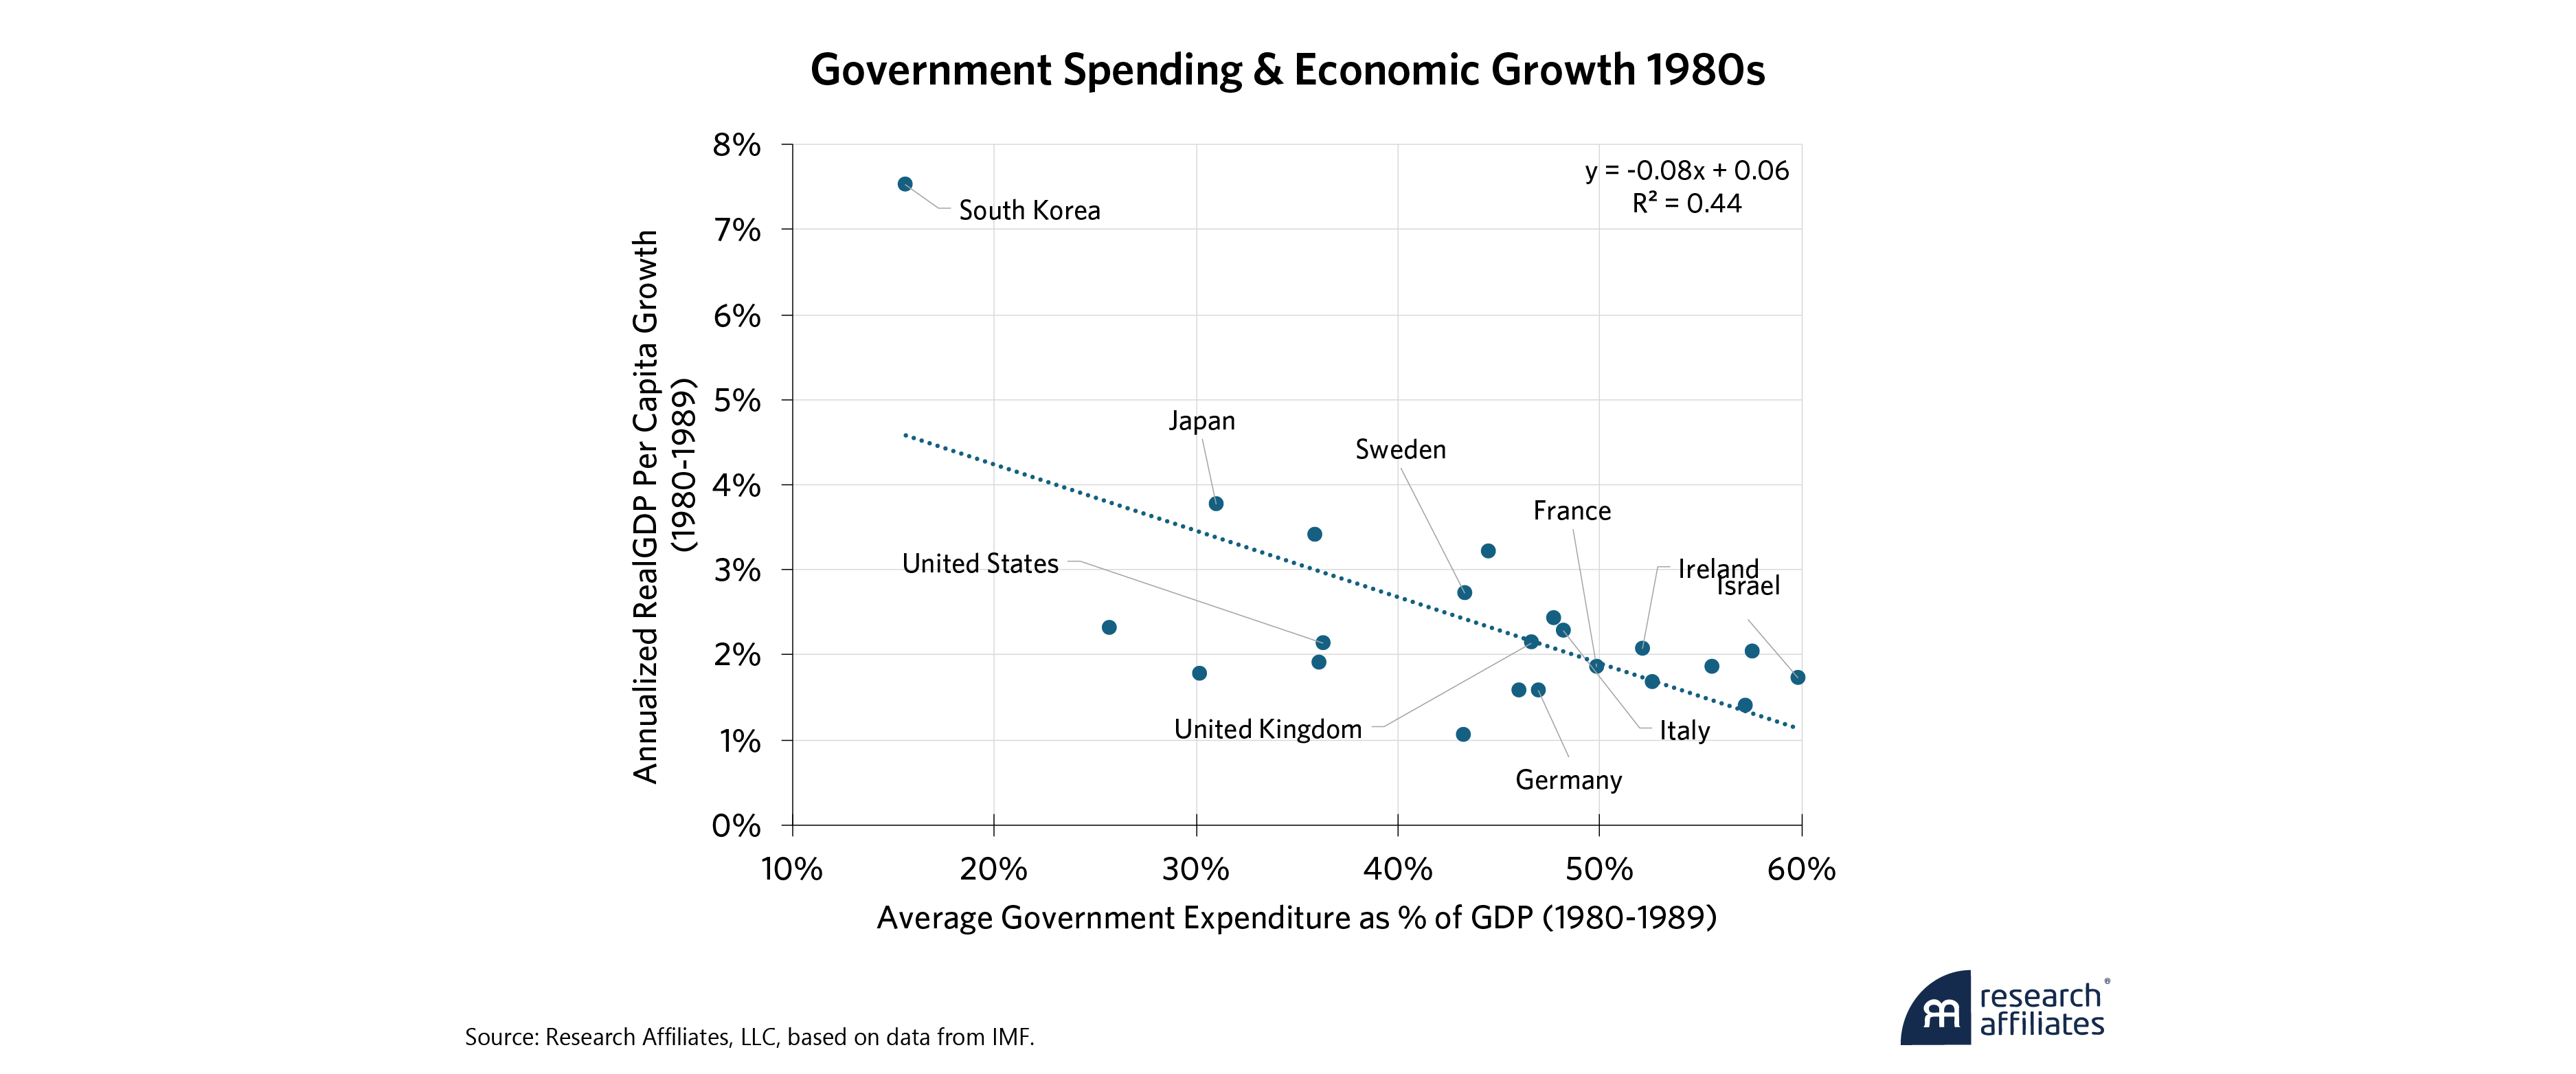
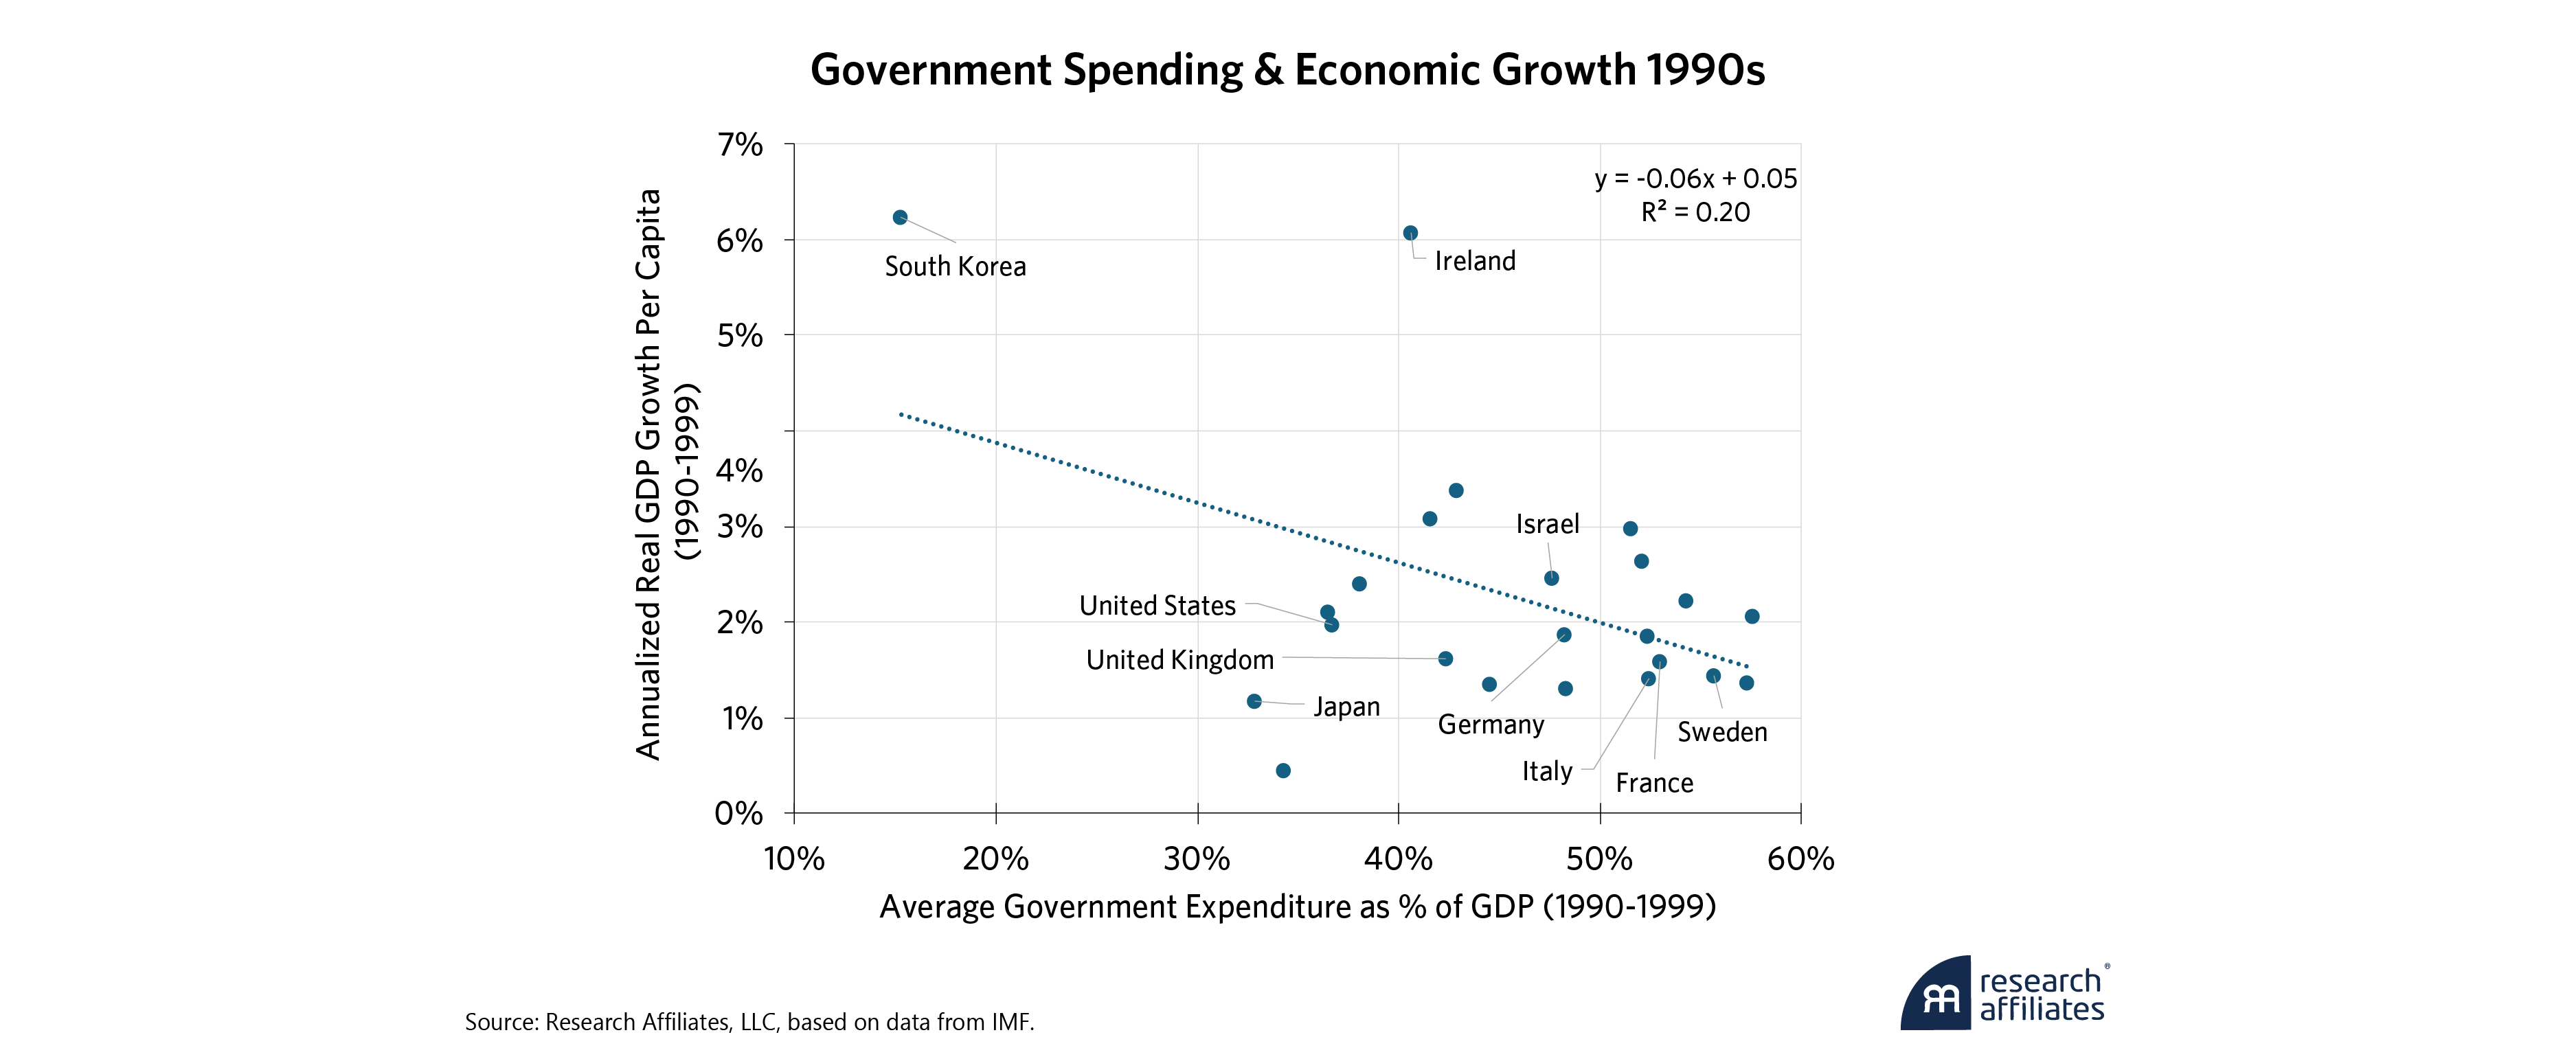
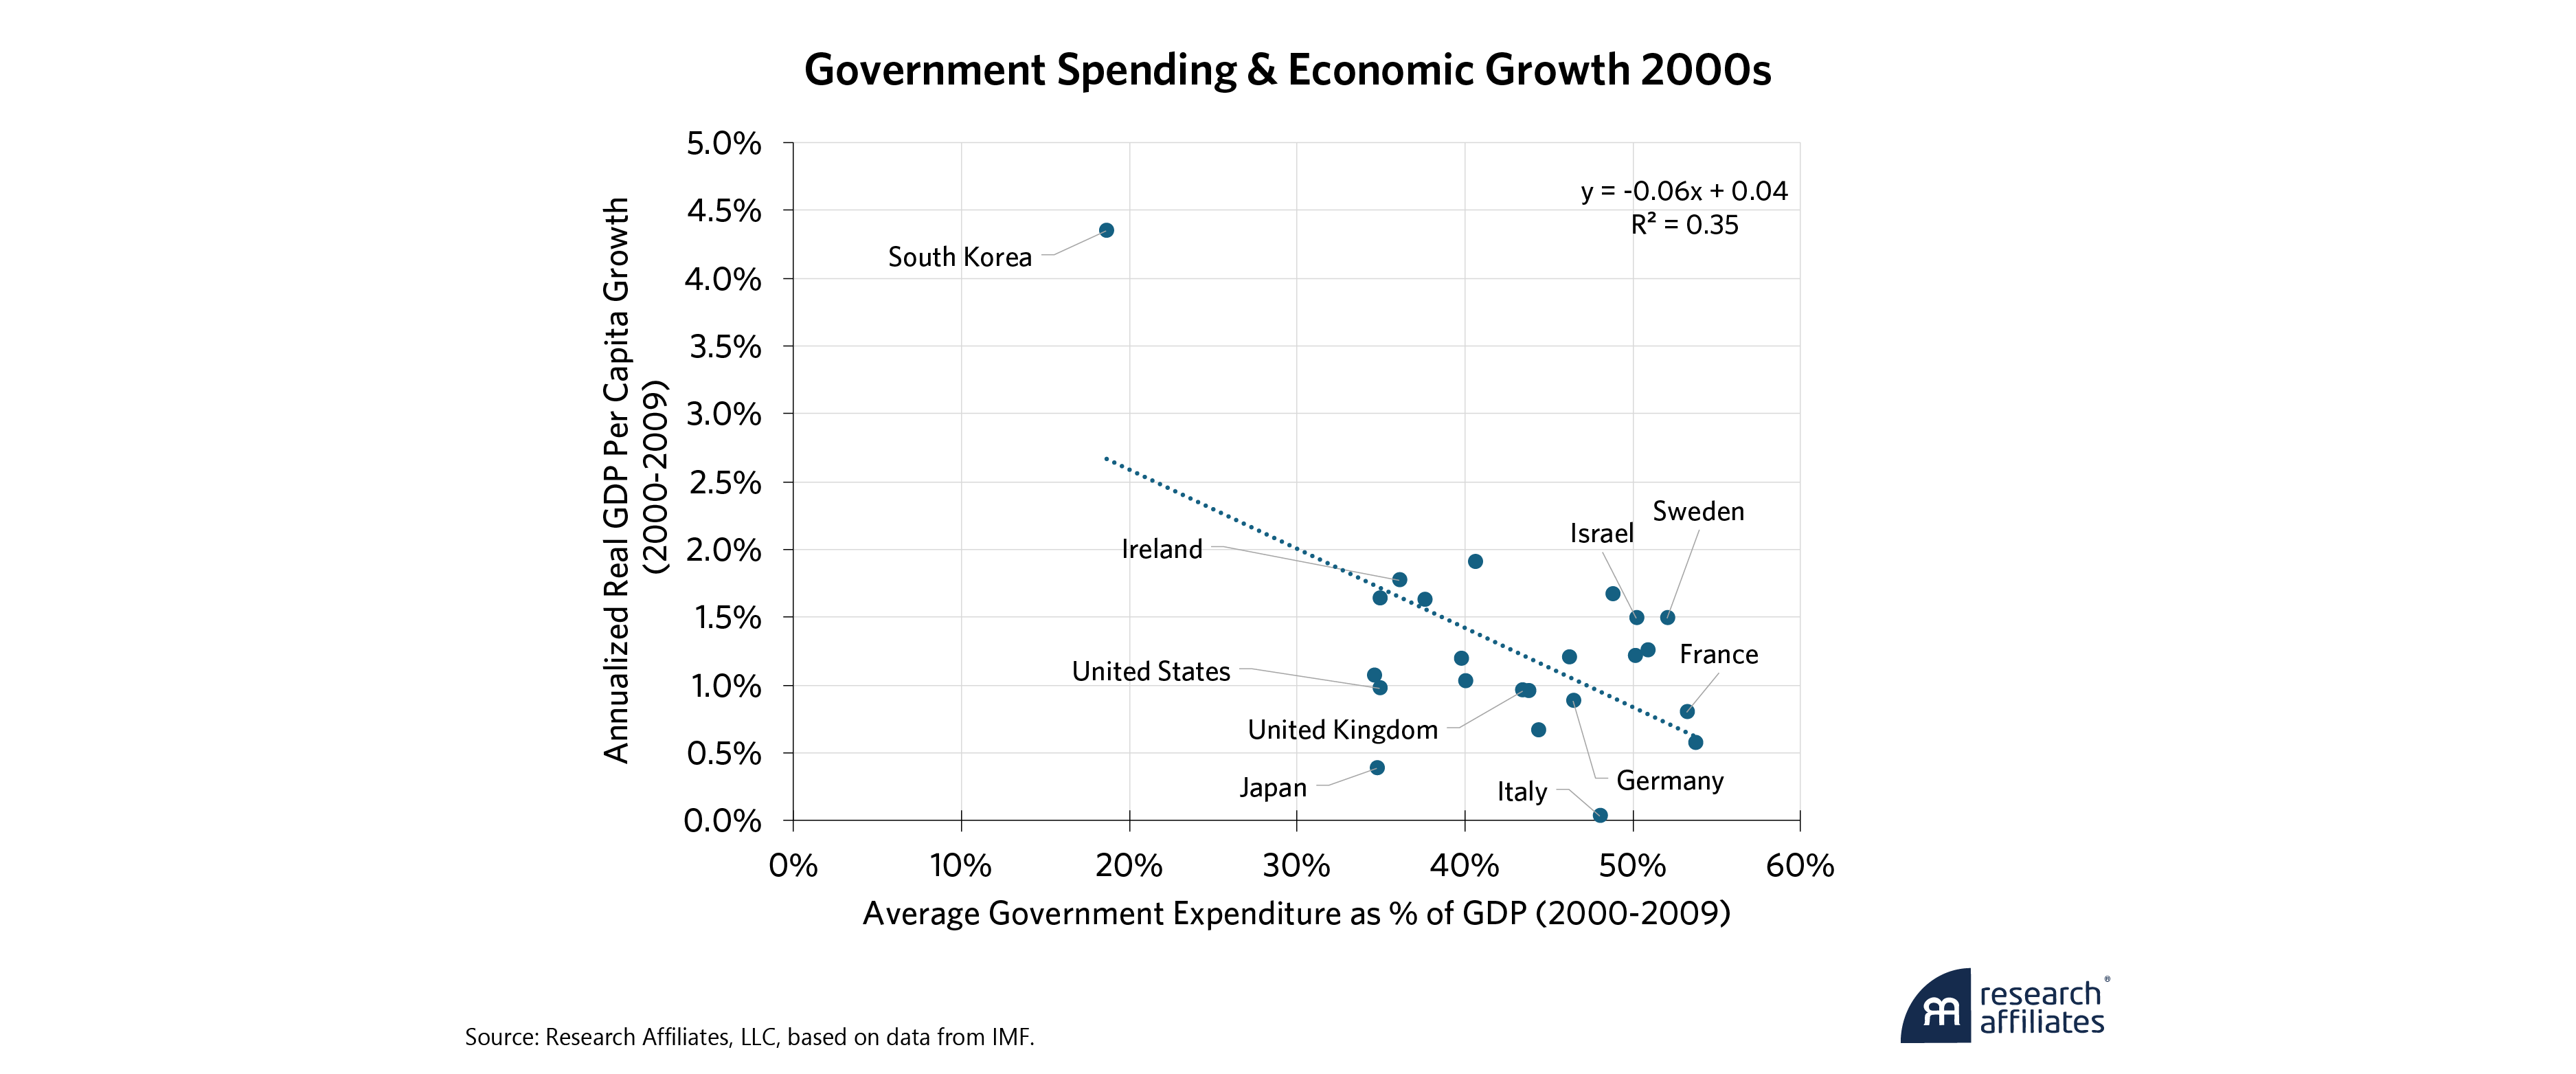
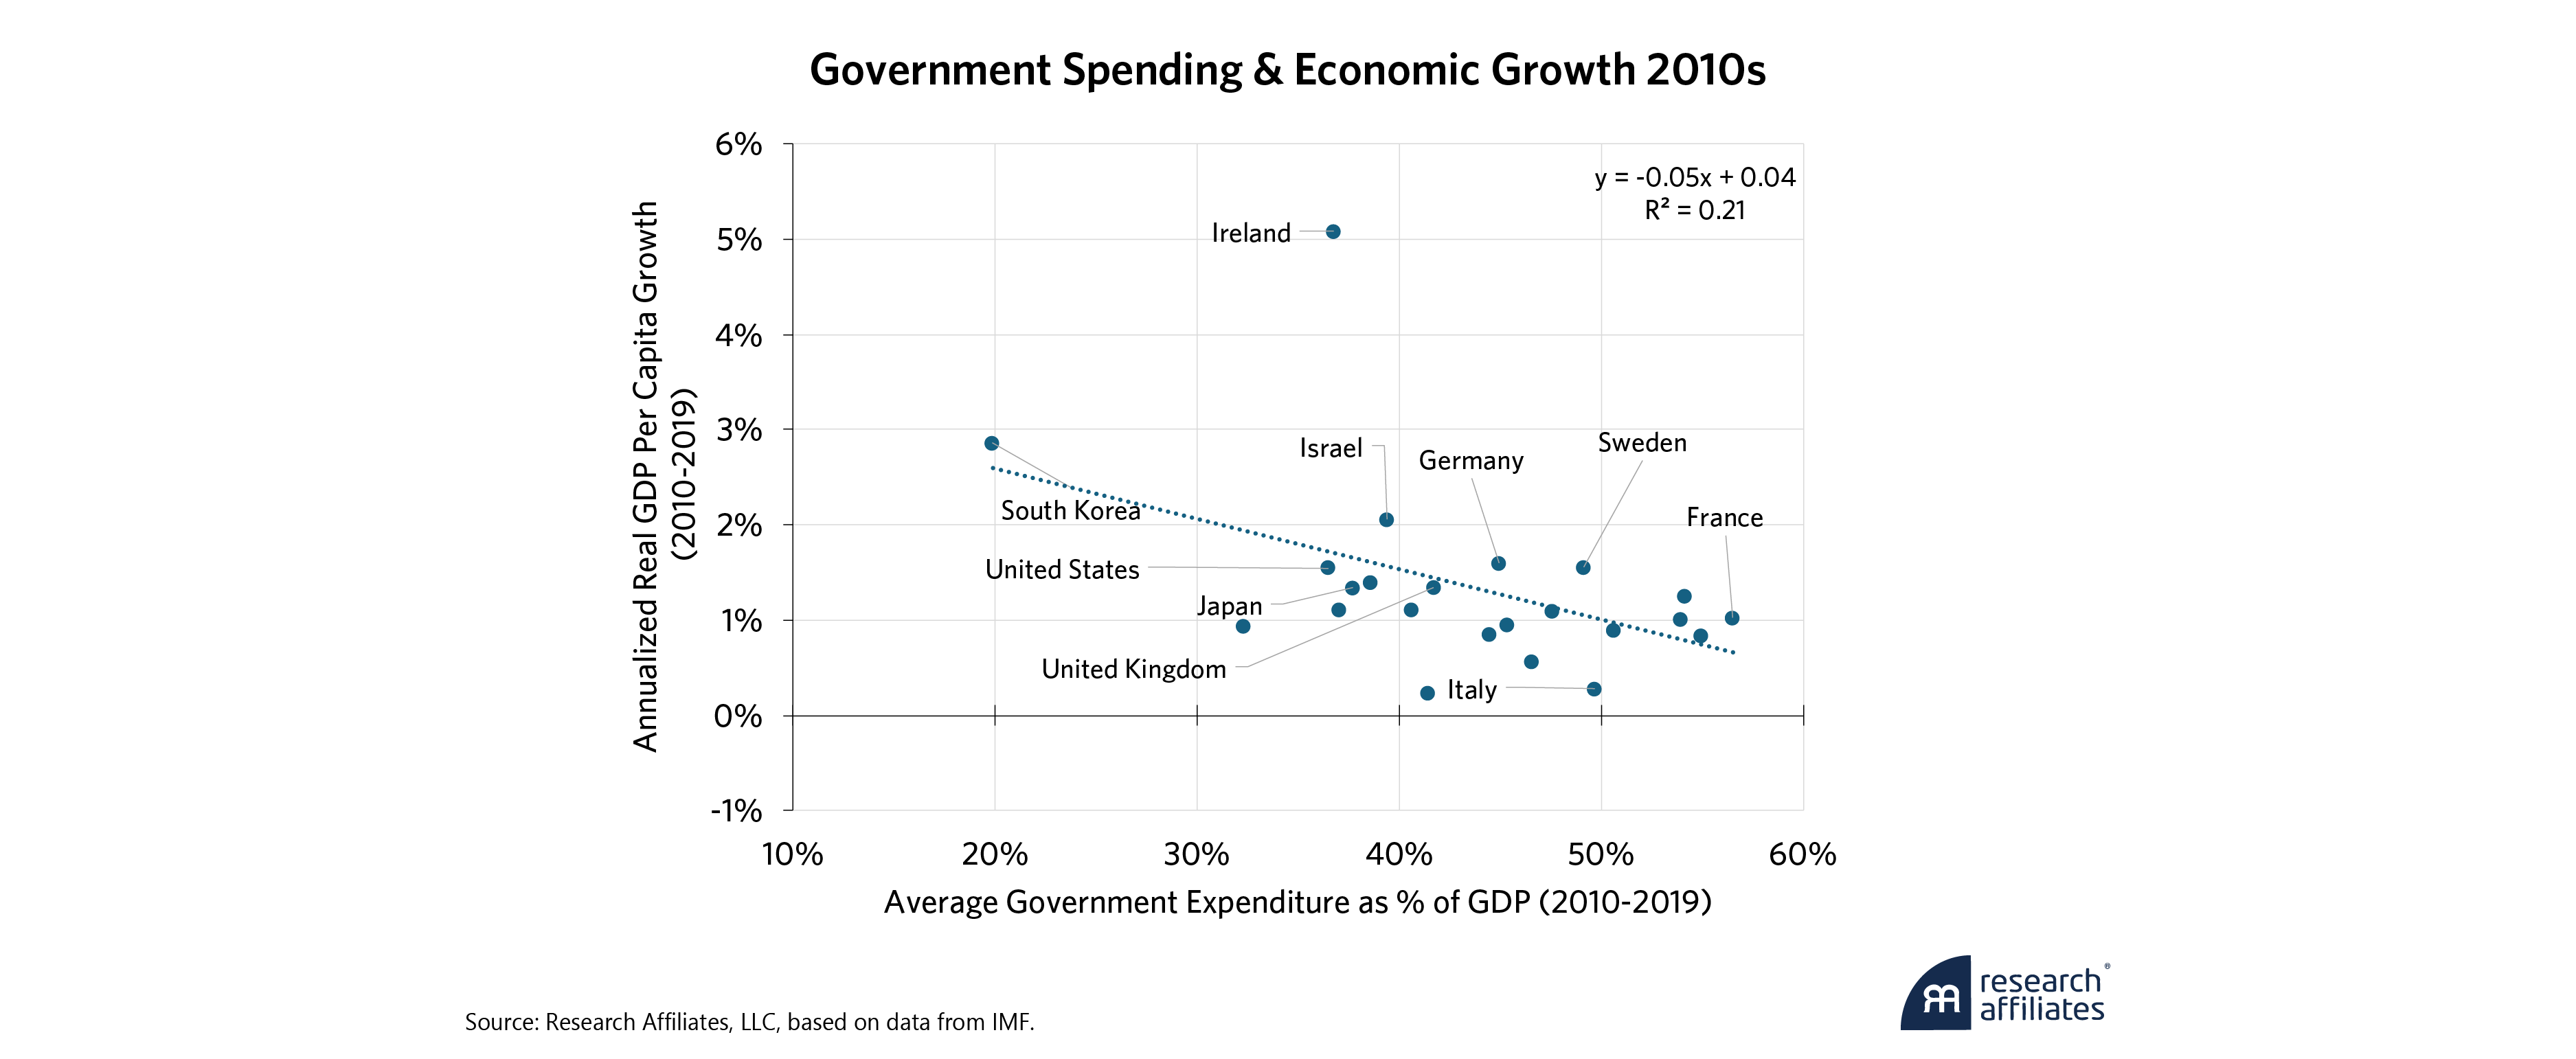
Among developed countries, however, too much government spending – particularly entitlement spending – crowds out private saving and investment, depresses labor productivity, and stifles growth of living standards. According to the IMF, US government spending at all levels of government is 37% of GDP. In comparison, many European governments spend 45% to 55% of their countries’ GDPs. Higher levels of government spending are associated with lower growth rates. The nearby chart displays this relationship for the 21st century. We plot the data for prior periods with similar results (see Appendix 2).
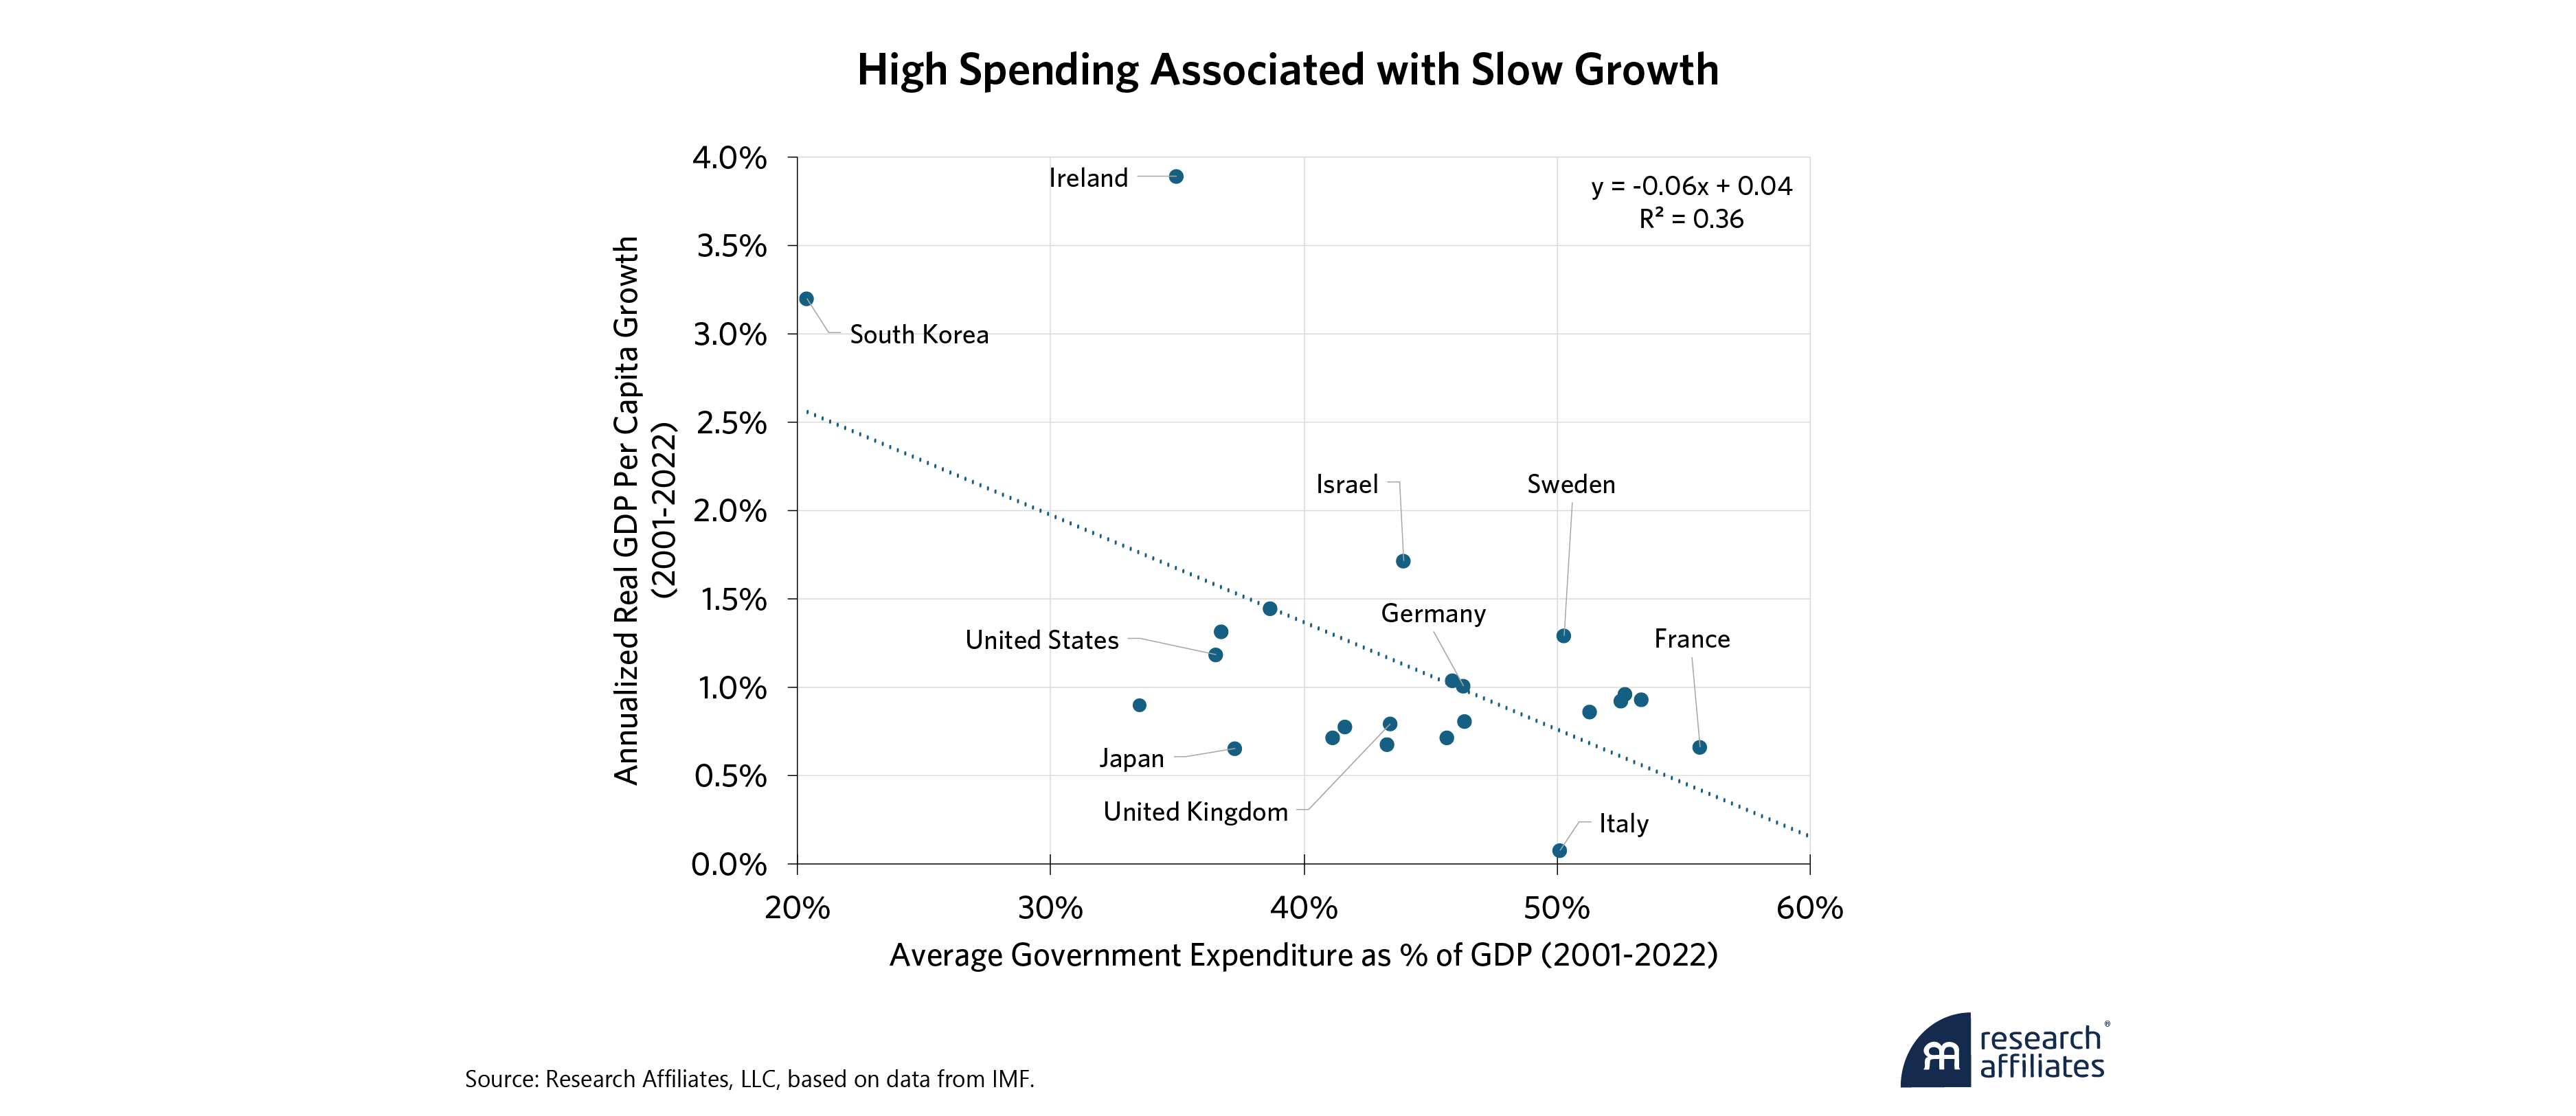
Many factors including investment, innovation, education, demography, and competition and trade policy influence relative rates of real per capita GDP growth. Given this plethora of explanatory variables, an \(R^2\) of 36% – a correlation of negative 60% – for government spending as a proportion of GDP appears remarkably high. If the US moves to European public spending levels, we will drift toward European real per capita GDP growth rates that average below 1%.
It’s Complicated
So far, to make our points clear, we have been telling a simple (albeit incomplete) linear story about our long-term fiscal policy. Federal budget deficits crowded out national saving; lower saving reduced investment; slowing investment diminished growth. While this story aligns with economic theory and 75 years of empirical evidence, the macro economy is neither simple nor linear.
We could tell a story about causation in the opposite direction. Enormous excess saving and investment in China over recent decades lowered global real interest rates, disincentivizing saving and investment in developed countries. Lower demand for investment resulting from the China shock reduced the need for domestic saving.
The strength of US institutions, pace of innovation, and remarkable profitability of leading US companies have attracted strong capital inflows. The resulting capital account surplus and appreciation of the US dollar demonstrate economic strength and reinforce confidence in US exceptionalism. Consequently, foreign capital inflows may accelerate and continue for many years.
Unless we reform our social security system before 2034, benefits will be automatically reduced by nearly a quarter. Thus, one might reasonably conclude that fiscal reform must happen by or before the early 2030s.
”Strong demand for US capital assets in general – and US Treasury securities in particular – reduces the pressure for and the urgency of fiscal reform. No one can say with certainty how much the US national debt may grow before creating a fiscal crisis: 120% of GDP? 150% of GDP? More? Regardless, fiscal reform eventually will be required because the current path is unsustainable.
Few expect fiscal reform during the next administration. The 2023 Social Security Trustees Report projects that its trust fund will be fully depleted by 2034. Unless we reform our social security system before then, benefits will be automatically reduced by nearly a quarter. Thus, one might reasonably conclude that fiscal reform must happen by or before the early 2030s.
In the meantime, we will have less fiscal space to respond to an economic shock. The US fiscal response to COVID created a nasty bout of inflation, suggesting we may have already used up our last bit of fiscal space. Many will be pleasantly surprised if we are lucky enough to avoid a fiscal crisis through the end of the current decade.
Yet, we remain optimistic. The US private economy remains healthy and tax receipts as a proportion of GPD are low relative to other developed countries. As we said in our January article, the necessary fiscal reform is economically easy but politically difficult. That doesn’t mean it won’t happen; when it must, it will.
Please read our disclosures concurrent with this publication: https://www.researchaffiliates.com/legal/disclosures#investment-adviser-disclosure-and-disclaimers.
Appendix 1: BLS Decomposition of Labor Productivity
Labor economists tell us that labor productivity is a function of not only capital investment, but also education, and total factor productivity (TFP). The Bureau of Labor Statistics’ (BLS) decomposition of labor productivity attributes its long-term decline entirely to TFP.
We view this decomposition with some skepticism; TFP is just the residual after subtracting difficult-to-quantify contributions of capital and education. With relatively static long-term estimates of the contributions of capital and education, the BLS attributes almost all variability in labor productivity over the decades to this residual.
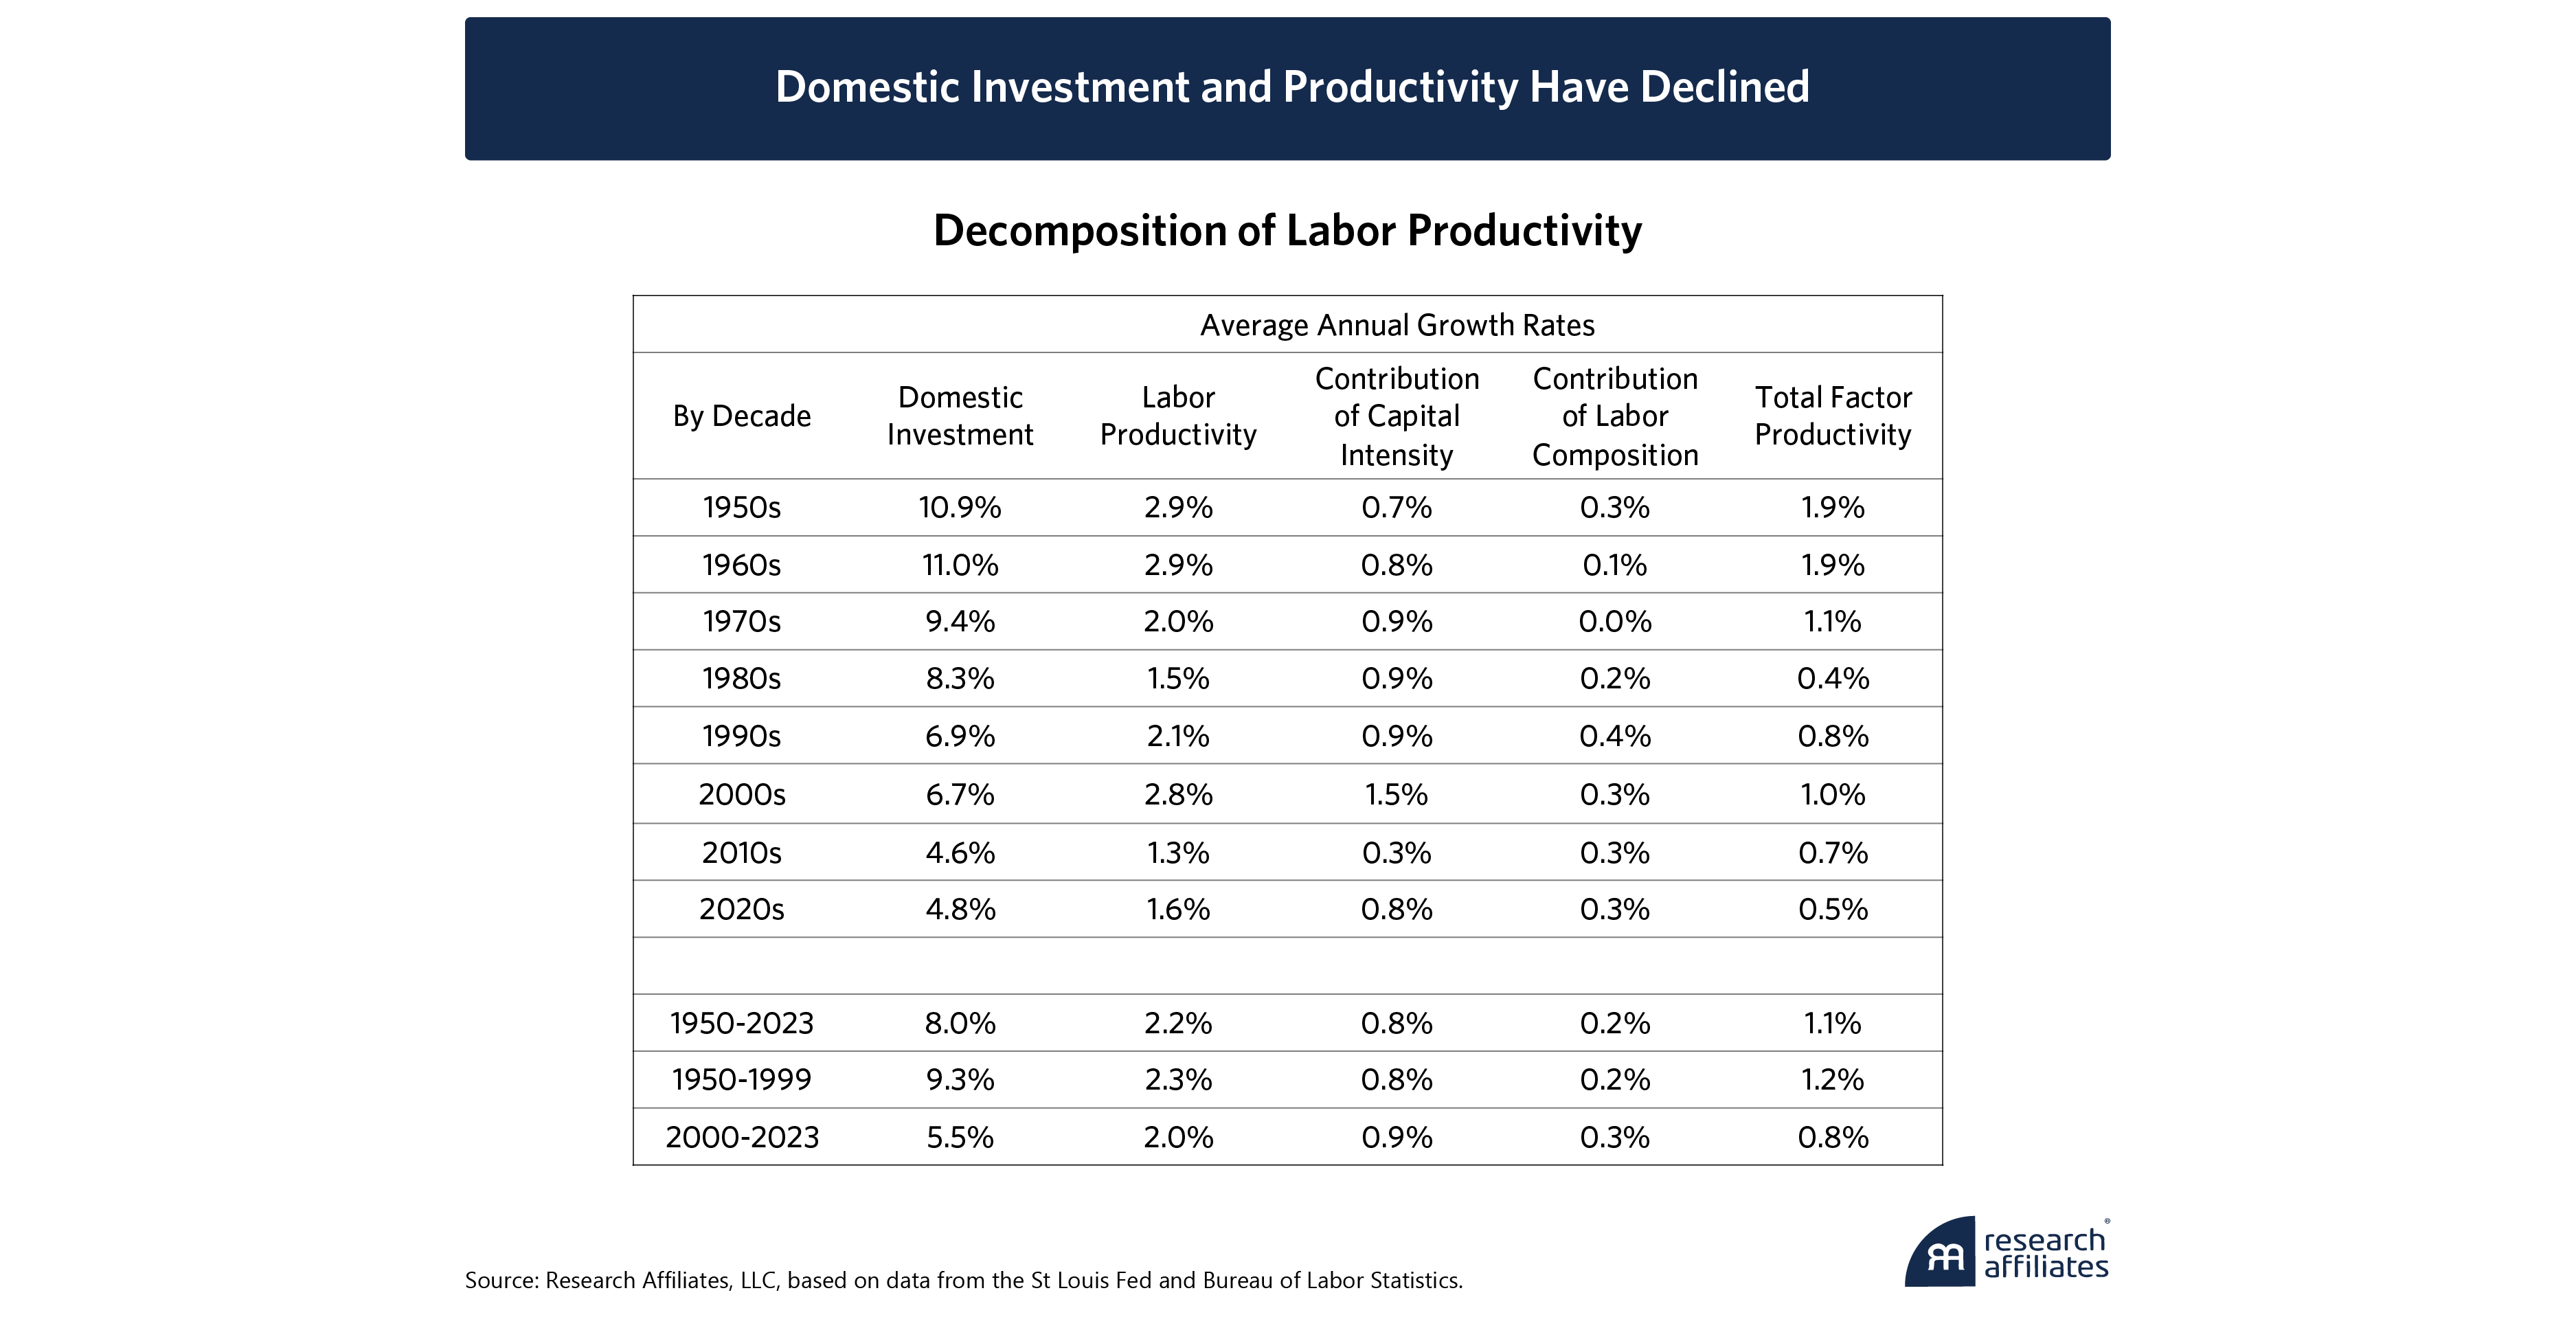
We believe, the more likely explanation for the slowing growth of labor productivity was lower capital investment. During the 1950s and 1960s when domestic investment was 11% of GDP, labor productivity grew by nearly 3% per year. By the 2010s, domestic investment had dropped by more than half to less than 5% of GDP, depressing labor productivity to less than 1.5% per year.
Appendix 2: Subperiod Analysis of Per Capita Real GDP Growth vs Government Spending