
Low carbon equity benchmarks developed by European regulators may maintain unintended factor exposures and characteristics investors should consider when choosing climate reduction strategies.
Our analysis shows that these benchmarks, especially Paris Aligned Benchmark (PAB) strategies, carry a growth tilt that make them vulnerable to changes in market sentiment and drawdowns in value markets.
The RAFI Multi-Factor Climate Transition Developed Index, which integrates carbon intensity reduction with a balanced multi-factor approach, offers investors an alternative to style-tilted low carbon benchmarks with a potential for outperformance across a greater range of conditions.
First-generation low carbon equity benchmark indices were developed almost a decade ago with the goals of mitigating climate risk and preparing for the transition to a low carbon economy. These indices aimed to simply have lower carbon intensity than the market within a given tracking error. As interest and adoption of low carbon benchmarks increased, so did the proliferation of new approaches with varying objectives related to climate measures.
In an effort to mobilize investment toward sustainable goals in a consistent manner, the European Commission published its Sustainable Action Plan in May 2018, which integrated sustainability risks, opportunities and targets into a regulatory framework. The Action Plan had several key initiatives with one being the development of low carbon investment benchmarks. To help assist in these initiatives, the Commission created the EU Technical Expert Group (TEG) on Sustainable Finance with representatives across financial services and academia.
Create your free account or log in to keep reading.
Register or Log in
In 2019, the TEG released its final report on Climate Benchmarks and Benchmarks’ ESG Disclosures.1 As part of this report, the TEG outlined recommendations, later adopted into EU regulation, for Paris Aligned Benchmarks (PAB) and Climate Transition Benchmarks (CTB). The purpose of creating these benchmark regulations was four-fold: 1) to allow for standardization and comparability of climate benchmarks, 2) to provide investors with an appropriate tool aligned with their investment strategy, 3) to increase transparency on investors’ impact, and importantly 4) to establish minimum requirements and limit the risk of greenwashing. Any index labeled as PAB or CTB must meet minimum requirements, such as a significant reduction in carbon intensity at index launch, and an additional reduction on an annual basis.2 While these guidelines were a welcome change in bringing structure and consistency to the climate investing space, there has been much debate on the requirements and their impact on index design. The purpose of this paper is not to enter into the debate in great detail,3 but instead examine the characteristics of a few popular PAB/CTB strategies and understand what types of style tilts, intended or unintended, investors might be getting along with their climate strategy.
The more aggressive a portfolio’s carbon tilting, the greater the reduction in allocation to value companies.
”In the paper, we examine four PAB/CTB index strategies. The strategies were chosen by reviewing the largest PAB/CTB ETFs in the developed markets globally, for which we could locate underlying index returns,4 choosing two PAB index strategies and two CTB index strategies. All strategies satisfy EU regulated PAB/CTB index requirements.
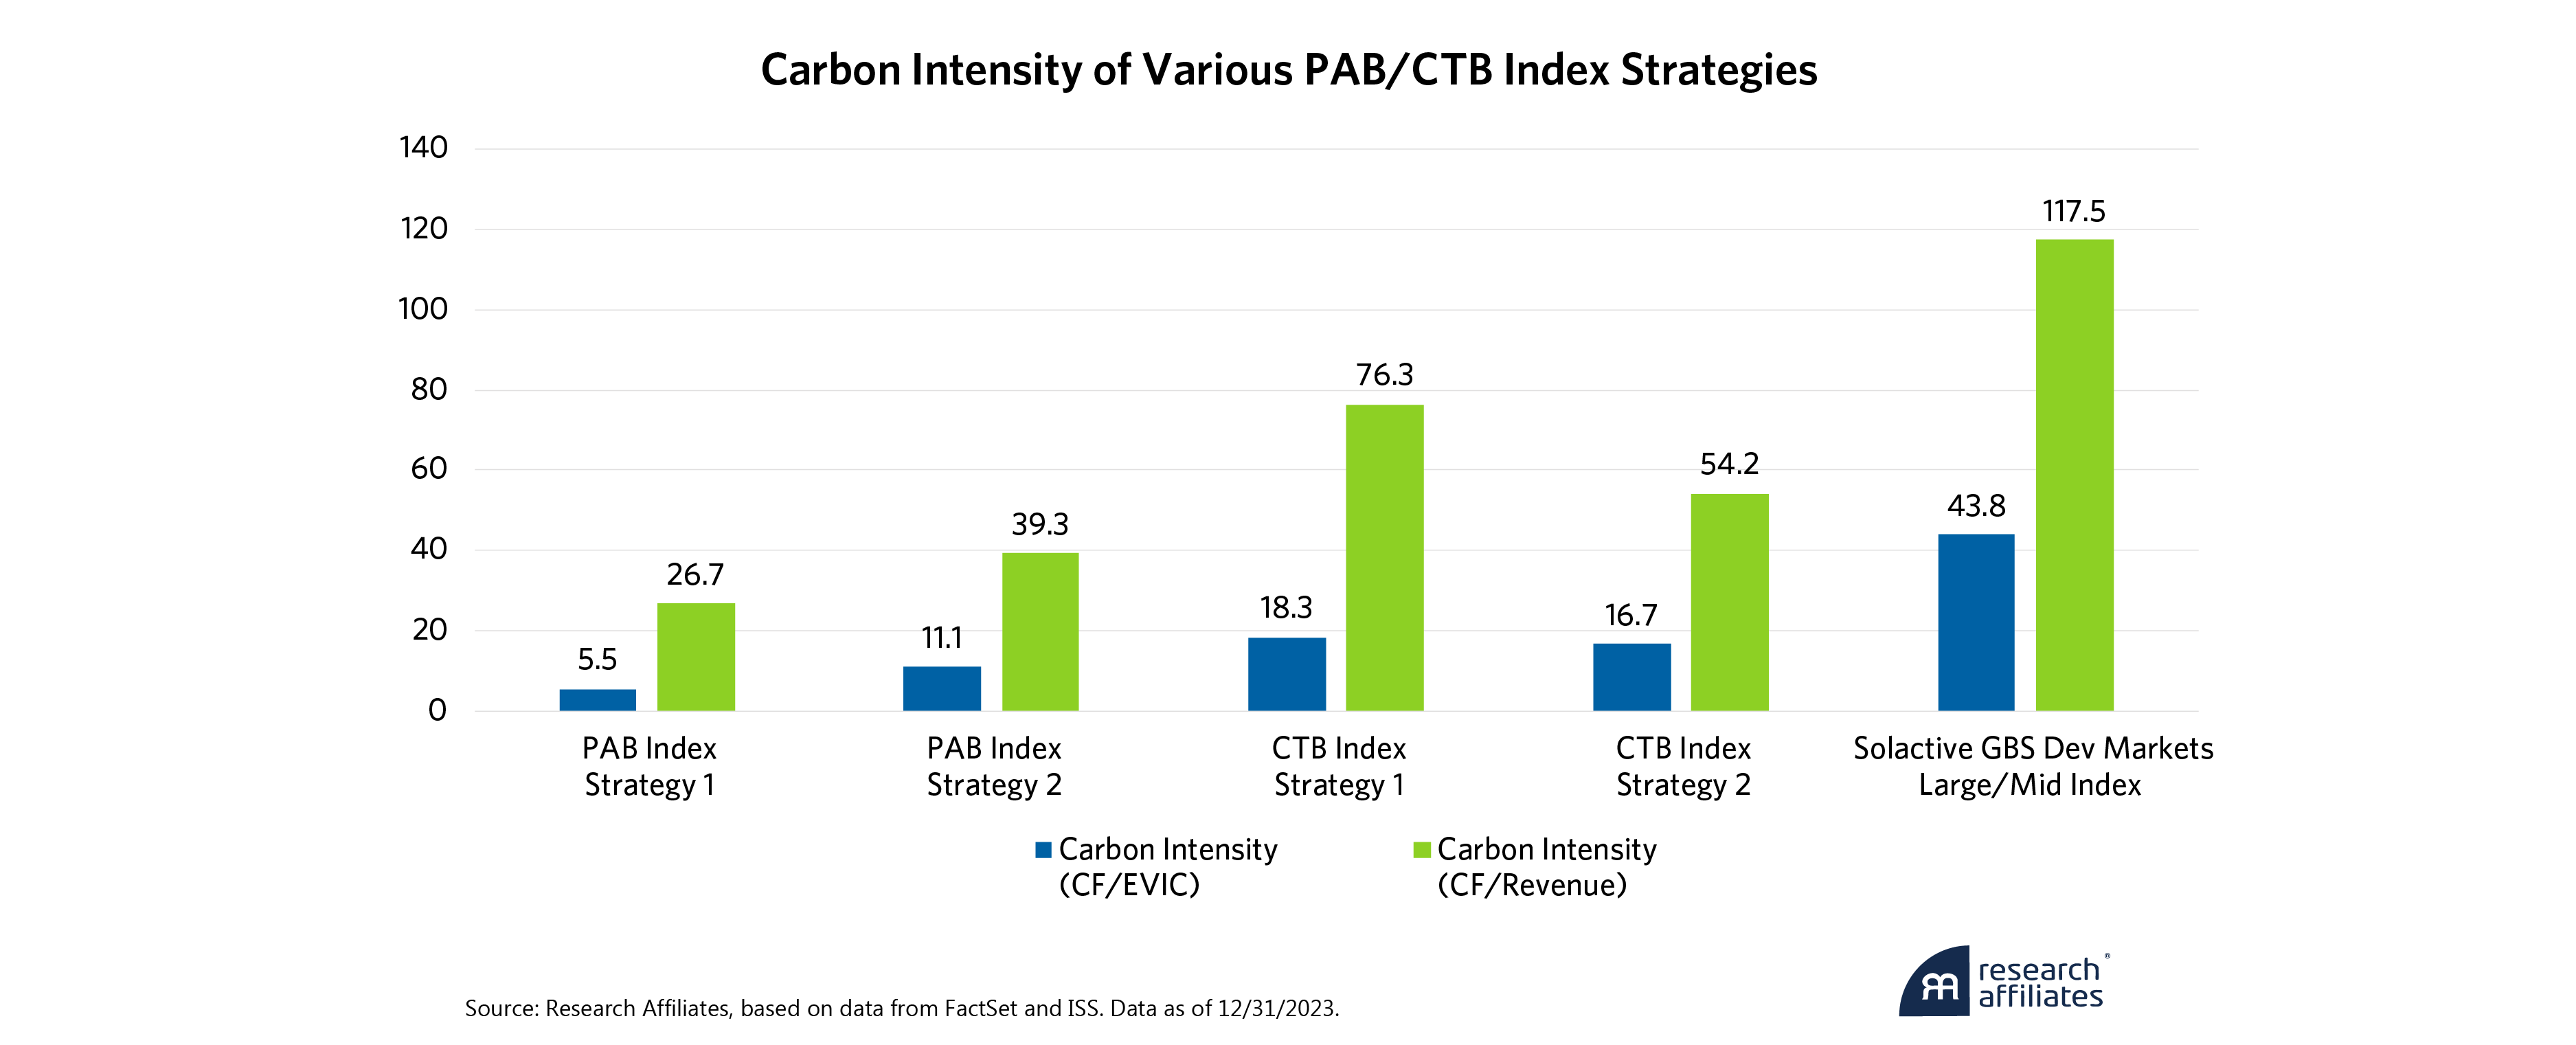
All four index strategies satisfy their primary objective, which is carbon intensity (CI) reduction,5 with the first two strategies understandably having much more aggressive CI reduction due to the fact that they are PAB indices rather than CTB indices. PAB index strategies require a much larger carbon intensity reduction at the outset (50% vs. 30%). While EU regulations require the construction of transition benchmarks to measure carbon intensity using the carbon footprint/EVIC (enterprise value including cash) measure, we also present the measure using carbon footprint/revenue, acknowledging that many investors assess their portfolio using that measure as well.
It is worth noting that PAB and CTB strategies have a time dependency associated with them. Depending on their launch date, some strategies may be further along their transition pathways than others. This, coupled with slight differences in the interpretation of the regulation, can result in different outcomes. As an example, both PAB strategies should, in theory, have similar carbon intensity levels (based on EVIC), but one is half that of the other.
While all the strategies examined achieve material carbon intensity reduction, characteristics vary with the PAB strategies looking more growth oriented. When looking at relative valuations vs. the market, the two PAB strategies trade at a premium of 29% and 13% respectively, while one of the CTB strategies trades at a 9% premium and the second at a slight premium to the market of approximately 2%.
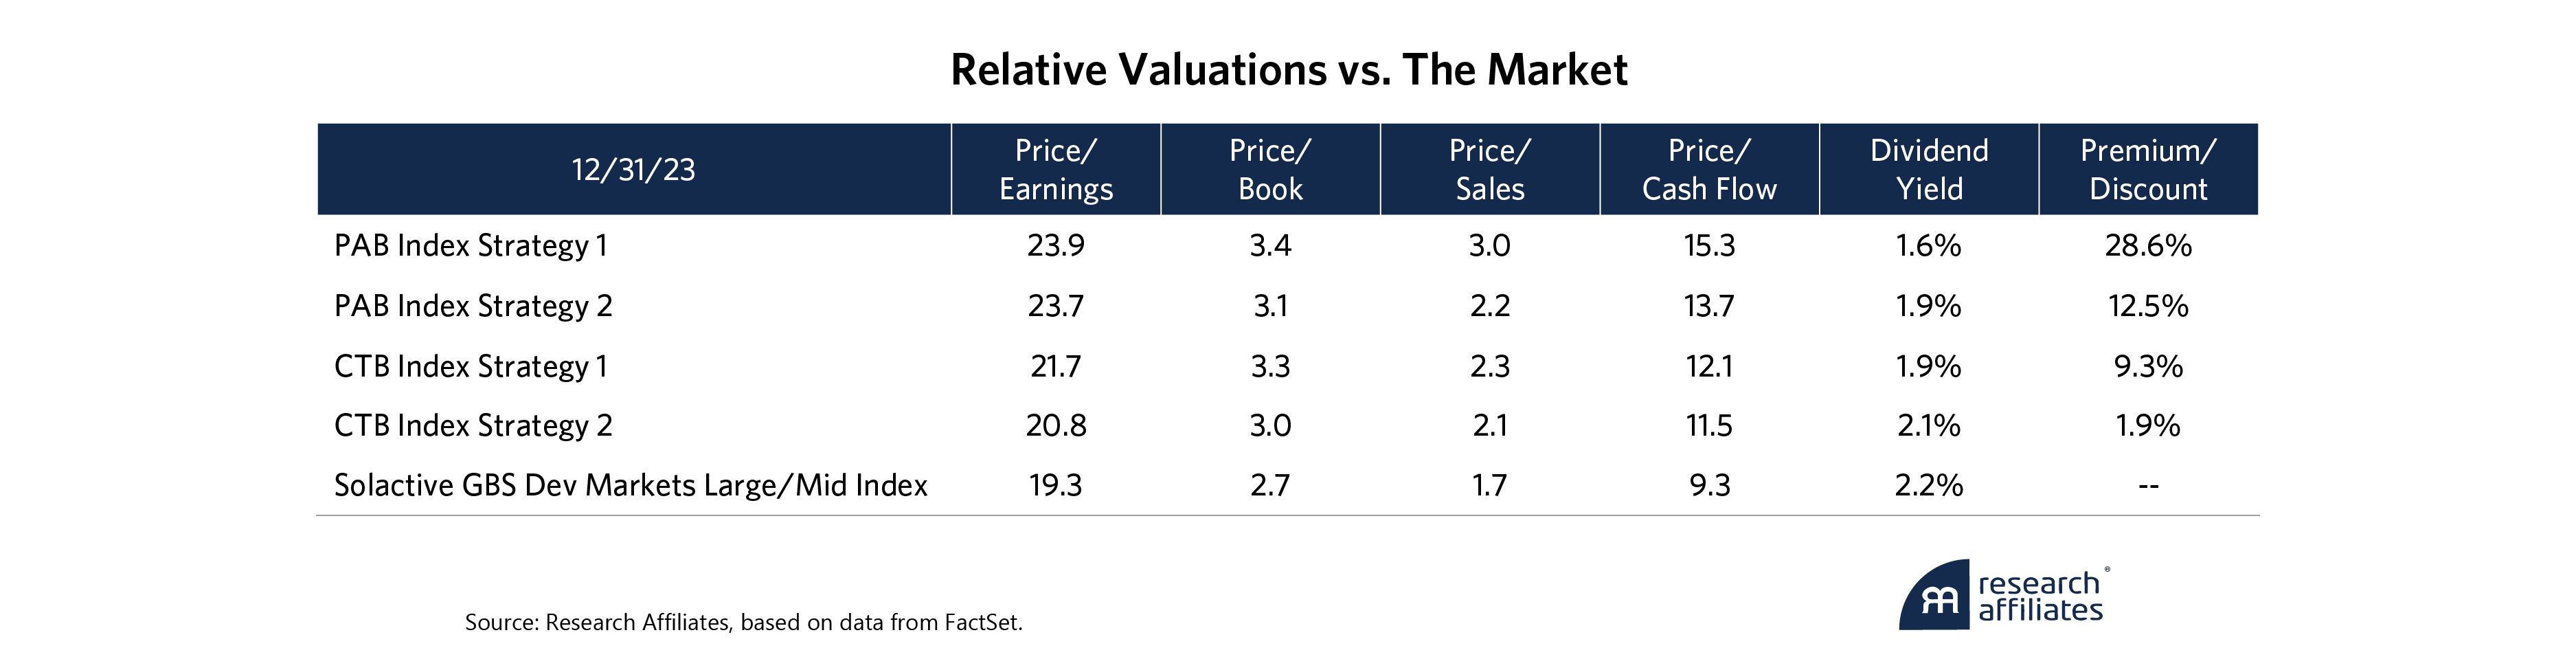
It is understandable that the PAB strategies trade at a much larger premium. In order to achieve more aggressive carbon intensity reduction, PAB strategies tend to tilt away from companies with high carbon intensity, (i.e. energy, materials and utilities), which have historically been in more value oriented sectors. The two PAB strategies we examine exhibit an average collective underweight to these three sectors of 4.1%, while the two CTB strategies exhibit an average collective underweight to these sectors of only 0.6%.
This growth tilt is also evident when comparing returns of the four strategies to performance in 2022 and 2023. In 2022, after years of a bull market in growth equities, we saw very out of favor segments like energy see sharp share price reversals. Value outperformed growth by 23% for the year, with more expensive growth companies seeing meaningful drawdowns of as much as 80% to 90%. The two PAB strategies underperformed the market by an average of 3.5%. Although 3.5% may not seem like a meaningful difference, for “passive” core-like exposure, such deficits are significant. Underperformance for the two CTB strategies was more muted at approximately -0.5%. When growth rebounded in 2023, the average outperformance of the PAB strategies was 1.2%, while the average underperformance of the two CTB strategies was 1.0%. The correlation of excess returns between these strategies and the MSCI World Growth Index help illustrate this relationship, with the two PAB Index strategies having a correlation of excess returns with growth of 0.70 and 0.48. The two CTB strategies have a noticeably different relationship with CTB Index Strategy 1’s correlation of excess returns with growth at -0.16 and CTB Index Strategy 2’s correlation at -0.01.6

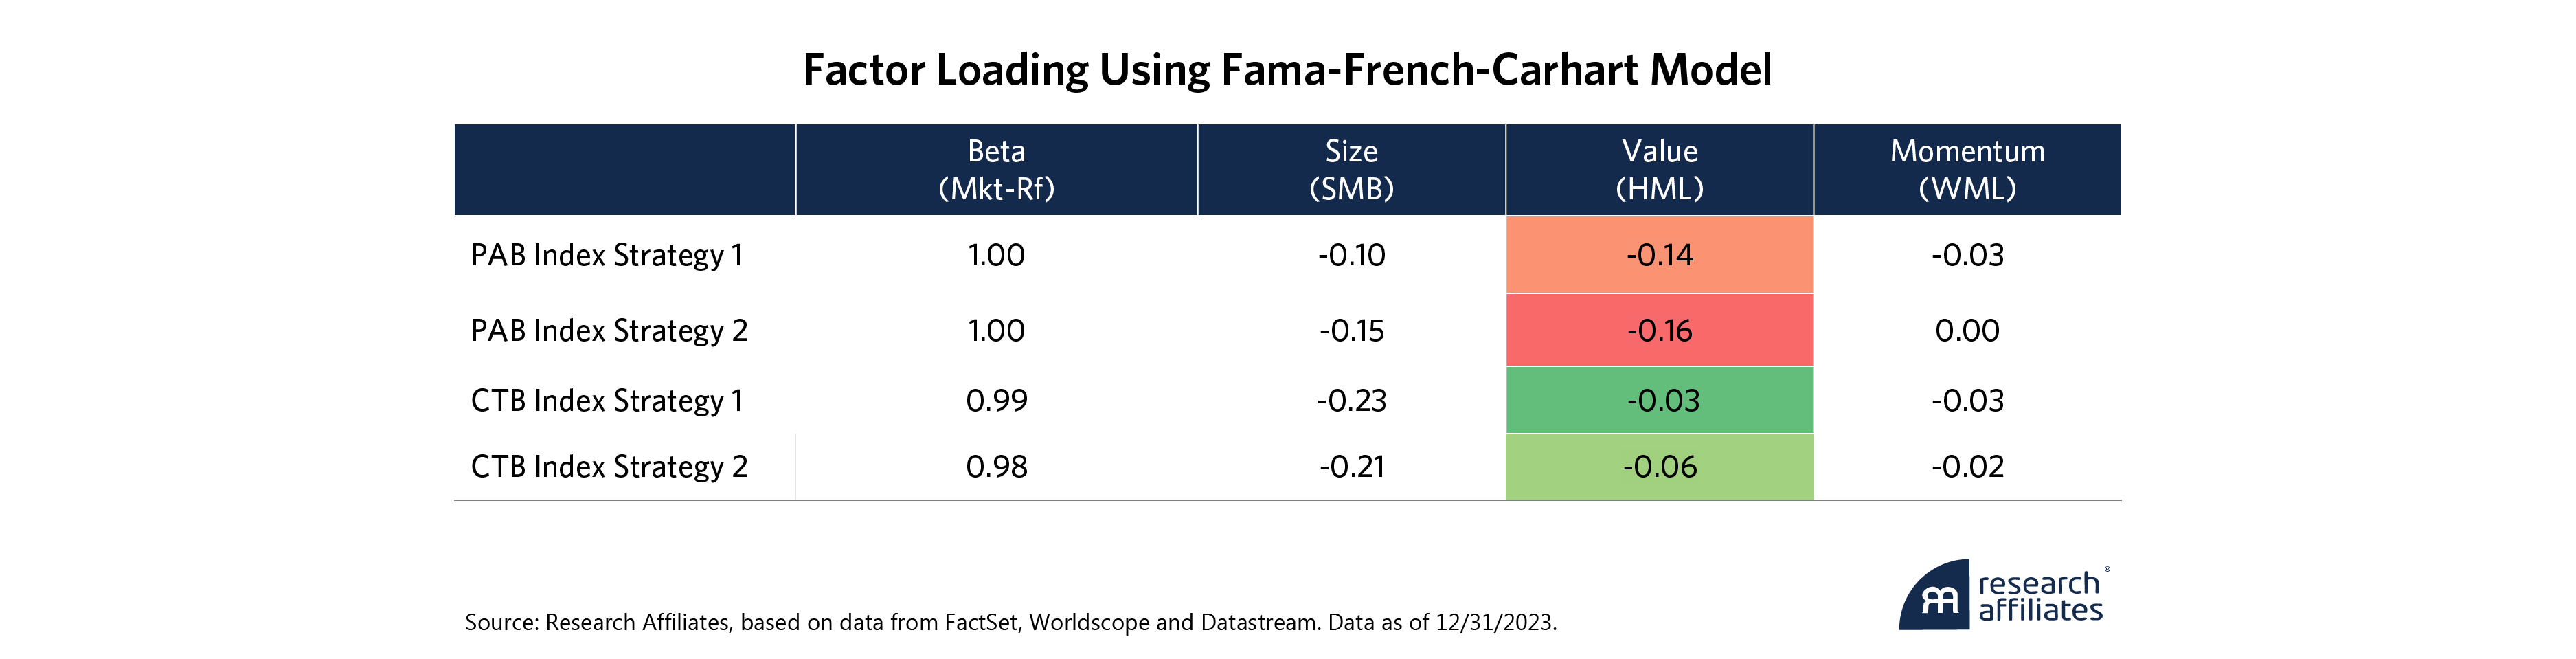
Viewed through another lens, we can observe the factor loadings of the four strategies using the traditional Fama-French-Carhart four factor model. The two PAB strategies have a statistically significant negative loading toward the value factor,7 both approximately -0.15. This noticeable tilt away from value contrasts with the two CTB strategies, with tilts of -0.03 for CTB Index Strategy 1 and -0.06 for CTB Index Strategy 2. Given the positioning of these portfolios, all four strategies are vulnerable — the PAB strategies much more so — to changes in market sentiment and at risk of drawdowns in a sharp reversion back towards value.
RAFI Multi-Factor Climate Transition Developed Index
In “Necessary Trade-Offs: Climate vs. Investment Objectives for Value Strategies”, we observe that trade-offs are required for investors with dual social and investment objectives. The more aggressive a portfolio’s carbon tilting, the greater the reduction in allocation to value companies. Achieving these dual objectives can be difficult and without deliberately engineering a portfolio to achieve these dual objectives, the strategy will likely tilt toward growth. The RAFI Multi-Factor Climate Transition Developed Index (RAFI CTB index) has two objectives: achieving carbon intensity reduction while also offering a balanced multi-factor approach. The RAFI CTB Index Strategy starts by constructing targeted and concentrated individual factor sleeves for value, quality, low beta and momentum. A carbon tilt, based on a company’s carbon intensity, is applied to tilt away from higher emitting companies and towards lower emitting companies.8
Without deliberately engineering a portfolio to achieve dual social and investment objectives, it will likely tilt toward growth.
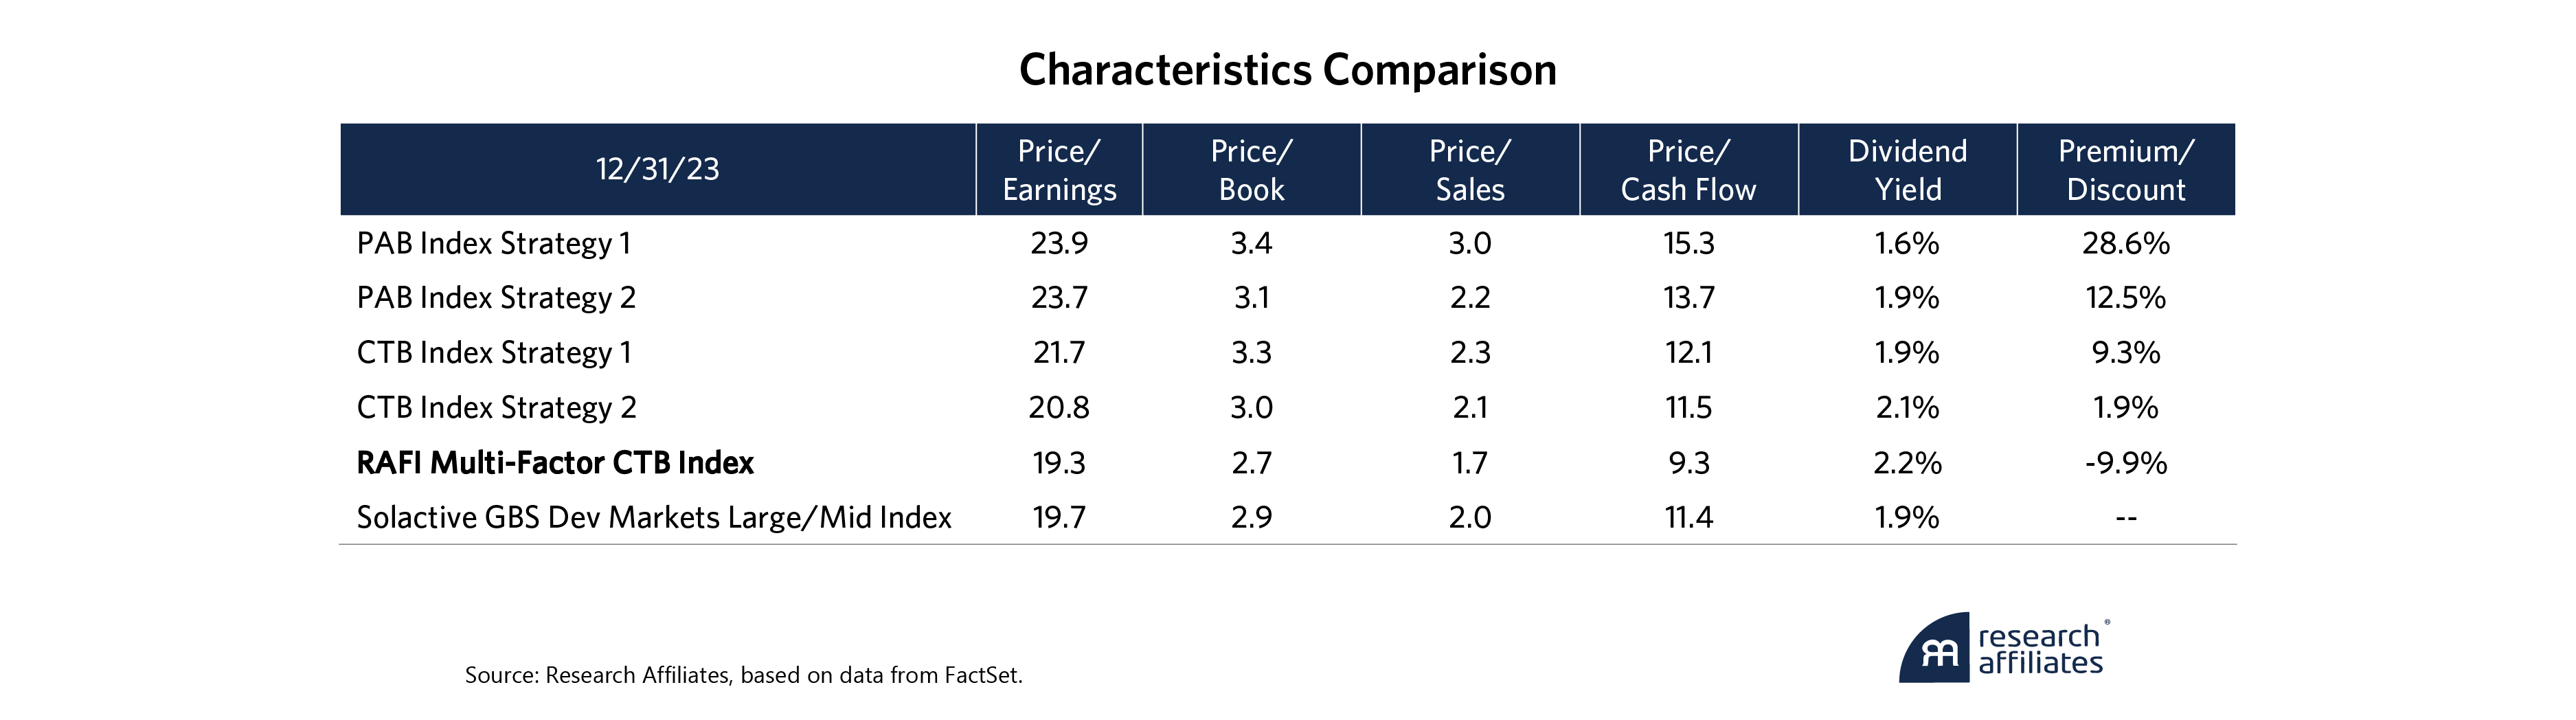
”This approach attempts to correct for the growth bias inherent in many climate strategies by specifically targeting factor exposures in addition to reducing carbon intensity. The resulting index provides a material reduction in carbon intensity, while maintaining exposure to various factors, offering the potential for outperformance in addition to carbon intensity reduction.9 The carbon intensity of the RAFI CTB Index is 25.3 compared to 43.8 for the cap-weighted benchmark, a 42% reduction.10 When comparing the characteristics of this strategy to the original four strategies and the cap-weighted index, we see noticeably different characteristics. RAFI CTB is the only index that offers a higher yield than the market benchmark, and trades at a 10% discount to the market, while all the other strategies trade at a premium.
Revisiting the correlations of excess return of various climate transition benchmarks, the RAFI Multi-Factor Developed CTB Index has a correlation of excess return with growth of -0.59, compared to the four PAB/CTB strategies which are all either positively correlated with growth, or not meaningfully correlated with either growth or value. In addition, RAFI CTB offers a positive exposure to both the value factor (HML) of 0.10 and the momentum factor (WML) of 0.12, something that none of the four PAB/CTB strategies exhibited.

Conclusion
The introduction of transition benchmark guidelines has been an important development for investors wanting to align their portfolios with their climate objectives in a standardized manner. However, it’s evident that not all climate transition benchmarks are the same. While investors may want to improve on the climate credentials within a passive index strategy, there can be meaningful return differences in different market environments, which begs a question of how passive some of these PAB and CTB strategies really are. In addition, many of these strategies exhibit significant growth tilts that may not be obvious to investors. Those investors interested in climate benchmarks should be aware of and look into the second order effects of climate adjustments, not only to validate the efficacy of a climate benchmark by its carbon intensity reduction, but also to holistically review its characteristics and factor exposures. The RAFI Multi-Factor Climate Transition Developed Index was designed with a dual mandate in mind, to offer investors an alternative of balanced factor exposures, in addition to satisfying their climate objectives.
Please read our disclosures concurrent with this publication:
https://www.researchaffiliates.com/legal/disclosures#investment-adviser-disclosure-and-disclaimers.

End Notes
1. EU Technical Expert Group on Sustainable Finance, 2019. “Report on Benchmarks” View report here.
2. Both PAB and CTB benchmarks require a significant carbon intensity reduction at index launch (30-50%), an additional reduction of 7% per year (adjusted for inflation) and exclusions of certain controversial activities/industries. For a full summary of minimum requirements, please see The Time is Now for Climate Transition Investing for US Investors.
3. We have addressed some aspects of the debate related to measurement of carbon intensity in the past in Carbon Intensity for Climate Mitigation.
4. Source: Morningstar. The strategies are the 1. MSCI World Climate Paris Aligned Index/HSBC MSCI World Climate Paris Aligned ETF, 2. MSCI World SRI Filtered PAG Net USD Index /Amundi MSCI World SRI Climate Net Zero Ambition PAB ETF, 3. JPMorgan Carbon Transition Global Equity Index/JPMorgan Carbon Transition Global Equity CTB ETF, and 4. Solactive UBS Climate Aware Global Developed Equity CTB Index/UBS Climate Aware Global Developed Equity CTB ETF.
5. Carbon intensity is measured using ETF holdings for each strategy, except for the RAFI Multi-Factor Developed CTB Index and Solactive GBS Developed Markets Large/Mid Index.
6. Index performance measured using net total return indices for each PAB/CTB strategy vs. the MSCI World Value Net Total Return Index and the MSCI World Growth Net Total Return Index.
7. HML t-stat is 10.84 for PAB Strategy 1 and 6.34 for PAB Strategy 2.
8. For a complete description of the RAFI Multi-Factor Developed Climate Transition Index, please visit RAFI Indices Strategies.
9. In "Is ESG a Factor" and "ESG is a Preference, Not a Strategy" we illustrate that investors should not expect outperformance from ESG tilts alone. As an investor, if you tilt a cap-weighted index toward lower emitting companies, you should expect a return that is largely in line with the cap-weighted index. For the potential for outperformance, an investor would need to tilt their portfolio toward historical drivers of outperformance, while simultaneously integrating ESG.
10. As of 12/31/2023, when measuring carbon intensity as Carbon Footprint (Scope 1+2)/EVIC. Measuring carbon intensity as Carbon Footprint (Scope 1 +2)/Revenue results in a carbon intensity of 63.1, a 46% reduction vs. the market benchmark, the Solactive GBS Developed Markets Large/Mid Index.
