
The AI Boom vs. the Dot-Com Bubble: Have We Seen This Movie Before?
The parallels between the AI narrative driving the current market and the dot-com bubble of a quarter century ago raise important concerns for investors.
The key to navigating any market narrative is less about adopting a strategy and more about developing an investment philosophy.
Market narratives fuel bubbles and crashes. Simplistic cap-weighted and naïve-value approaches may not be the best ways to capture the opportunities or mitigate the asymmetric risks these narratives present.
The Research Affiliates Fundamental Index (RAFl) weights companies based on their real economic impact, creating a balanced portfolio that avoids the extremes of its conventional value- and capitalization-weighted counterparts.
The future belongs to artificial intelligence (AI) and the companies leading the AI revolution. So goes today’s popular investment narrative, and in 2023 and 2024 at least, the stock market followed along with it. The Magnificent Seven—Alphabet, Amazon, Apple, Meta, Microsoft, NVIDIA, and Tesla—soared to incredible heights, while the relative valuation multiples of small-cap and value stocks plumbed depths not seen since the 2020 pandemic panic or the 2000 dot-com bust.
Create your free account or log in to keep reading.
Register or Log in
But thus far in 2025, these tech giants haven’t been so magnificent. Some have stagnated or even declined, calling the ascendant storyline into question. Is the market’s AI fever all it’s cracked up to be? Is this time really different? Maybe. And maybe John Wick 5 will end with Keanu Reeves’s titular character laying down his arms, embracing pacifism, and dying an ignominious death. In other words, maybe, but probably not.
For long-horizon investors, the current market calls for caution. Narrative-driven markets can always create asymmetric risks, and while history tends to rhyme rather than repeat, the similarities between the turn-of-the-millennium dot-com bubble and today’s AI exuberance are too obvious to ignore.
But that doesn’t mean investors have a simple binary choice. A conventional cap-weighted portfolio or its antithesis, a value strategy that shuns the popular AI narrative entirely, would each impose unnecessary limits. Either approach could underperform—either during the initial boom or after the hype fades and the proverbial bubble bursts.
Instead, investors should weight their allocations based on a company’s actual economic footprint through a fundamental index. The Research Affiliates Fundamental Index (RAFI), for example, is grounded in economic reality as reflected in company fundamentals. It offers a robust framework to help portfolios navigate the market’s inevitable ups and downs and also captures a powerful rebalancing alpha by reducing or augmenting its allocations when a stock’s price meaningfully departs from its underlying fundamentals.
Markets Love a Compelling Narrative
Powerful stories drive returns and propel bull and bear markets alike. They have an undeniable and often era-defining allure. The dot-com bubble, the COVID-induced value crash, and the recent AI-fueled bull market all demonstrate their power and appeal. The good news is that these stories are often largely true, which is why people believe them. The bad news is that by the time they fully take hold, their value may already be captured, if not exaggerated, by current share prices. As a result, these narratives are useless unless investors identify where they are wrong or where they have asymmetric risks.
The internet will change everything. That was the story of the dot-com bubble: The “information superhighway” would revolutionize how we work, communicate, socialize, and inform ourselves. It was all true. Yet the 10 most valuable tech stocks in 2000 underperformed the S&P 500 for the next 15 years. Why? Because the narrative missed two important nuances: It assumed that early dominance meant enduring dominance, and it overestimated the pace of change.
In the dot-com era, as in all others, disrupters were disrupted. The smartphone pioneer Palm, Inc., for example, was more valuable than General Motors in early 2000. By 2003, however, it had been overtaken by BlackBerry, which achieved its peak 20% share of the global smartphone market in 2009. BlackBerry’s reign was also short-lived. Apple launched the iPhone in 2007 and surpassed BlackBerry three years later. By 2013, BlackBerry accounted for less than 1% of the smartphone market and less than 0.1% by 2016. Technological disruption is unforgiving, and amid intense innovation and competition, industry leaders can be quickly dethroned.
The narrative of the 2020 pandemic value crash was an extension of the dot-com story. COVID-19-related lockdowns meant that internet technology would finally come to dominate communication and commerce. Value players, particularly in “in-person” industries, would face sweeping bankruptcies as the world adapted to the pandemic. It was all wrong. The stimulus blowout, among other factors, forestalled business failures and primed the pump of pent-up demand that would revive the restaurant and travel sectors. Value companies fared just fine, for the most part, even as value stocks took a drubbing.
The story of the AI-fueled growth market of 2023 and 2024 closely echoes that of the dot-com bubble. Like internet technology, AI will transform the world. It will anticipate our needs and wants, conduct our research, and predict the future better than any of us mere mortals. It will also displace millions of highly skilled workers.1 The leaders of AI today will be the leaders of tomorrow because they are creating that tomorrow. The transition will be astonishingly swift, with AI surpassing the intelligence of Nobel laureates by 2026 and the combined knowledge of all of humanity by 2027.2
This AI narrative, like its dot-com predecessor, may be largely correct. Anyone who has tinkered with ChatGPT knows that user-friendly AI is transformational. But as with all technological innovation, the pace of human adoption may be slower than the visionaries predict. Modern-day Luddites and digital immigrants will delay the inevitable embrace of these new innovations. Some early leaders may lose their edge amid the fierce competition or even disappear altogether.
Like the internet highflyers of 2000, today’s AI darlings must exceed already lofty expectations to beat the market in the years ahead. If cracks form in the narrative—if the fundamentals fail to keep pace with investors’ fanciful projections—the broader story may begin to crumble and even collapse completely. This can cause sharp market downturns, outsized investor losses, and a cascading effect that turns bull markets into bears.
When markets buy into a narrative, pricing in the best possible outcomes and ignoring the potential challenges, asymmetric risks develop. We love asymmetric risks. For instance, what if AI, like the internet, takes a decade or two to embed itself into the economy?
And what if today’s AI leaders are themselves displaced? High-margin businesses attract competition. This costs the top players market share and erodes their pricing power and profit margins.
When markets buy into a narrative, pricing in the best possible outcomes and ignoring the potential challenges, asymmetric risks develop. We love asymmetric risks.
”The dot-com bubble from 1998 to 2000 is a cautionary example of these dynamics. Fueled by otherworldly expectations about the internet’s potential, the stock market blasted off, led by the “Four Horsemen”— Cisco, Dell, Intel, and Microsoft. Then, from 2000 to 2003, the bubble deflated as the narrative outstripped economic reality. After surging nearly 400% in the roughly three years preceding its March 2000 peak, the Nasdaq-100 plunged more than 80% to its October 2002 trough. The broader S&P 500 nearly doubled during the boom but then declined almost 45%.
The bubble ended in an oddly narrow bear market as cheap stocks initially shrugged off the headwinds. From March 2000 to March 2002, the Nasdaq-100 fell 67% and the S&P 500 21%. But value and small-cap stocks stayed basically flat, with the Russell 1000 Value rising 5% and the Russell 2000 falling 3%, while small-cap value stocks surged, with the Russell 2000 Value rallying 49%. For many stocks, the late 1990s bull market lasted until March 2002! The moral of the story? Cheap stocks can sometimes weather bursting bubbles.
The dot-com bubble’s final collapse, however, was a take-no-prisoners rout. From March 2002 to the October 2002 bottom, the Nasdaq-100, S&P 500, Russell 1000 Value, Russell 2000, and Russell 2000 Value all tumbled between 20% and 30%. Still, in contrast to the Nasdaq-100’s roughly 83% decline from March 2000 to October 2002, the Russell 2000 Value rose 16%. When propelled by a nothing-can-possibly-go-wrong narrative, prices can crater when it looks like the story doesn’t add up.
Is 2025 the New 2000?
The Magnificent Seven are the successors to the Four Horsemen in today’s market, and the AI storyline is a sequel of sorts to the dot-com era’s internet revolution. In both instances, the technology-driven narrative and the accompanying speculative market sentiment drove valuations to extremes. We made the comparison back in 2023, warning—too early, of course!—of the potential downsides and reminding investors that froth begets fizzle.
The current economic and technological landscape differs from that of the dot-com years, but the same risks still loom large. To capitalize on the upside without being blindsided by the downside, investors must position themselves with an eye towards the narrative’s potential vulnerabilities, and for that, the lessons of the dot-com are instructive.
After all, only one of the Four Horsemen—Microsoft—has beaten the S&P 500 over the past quarter century. Will the Magnificent Seven stocks fare any better? For its part, the film The Magnificent Seven offers a rather ambivalent answer. Four of the seven are dead by the closing credits, and not one emerges unscathed.
Emergent Market Leaders
Of today’s Magnificent Seven, one has taken the leading role. NVIDIA produces the graphic processing units (GPUs), the "picks and shovels," that power AI applications. In the dot-com era, Cisco served a similar purpose, providing the networking hardware—the routers and switches—that connected people and businesses to the World Wide Web. In June 2024, NVIDIA briefly surpassed Microsoft as the most valuable company in the world.3
NVIDIA and Cisco demonstrate how emergent market leaders can transform from niche players into iconic representatives of a rapidly-evolving technology almost overnight. In a recent five-year period, NVIDIA shares rose more than 2200%. During a similar time frame in the run-up to its 2000 peak, Cisco shares jumped a vertigo-inducing 3700%, and Qualcomm soared over 2600% in a single year.4 Such gravity-defying trajectories exemplify narrative-driven markets and demonstrate what Cornell and Damodaran (2020) call a “big market delusion”—when the hype surrounding a nascent industry outpaces a realistic assessment of its future.
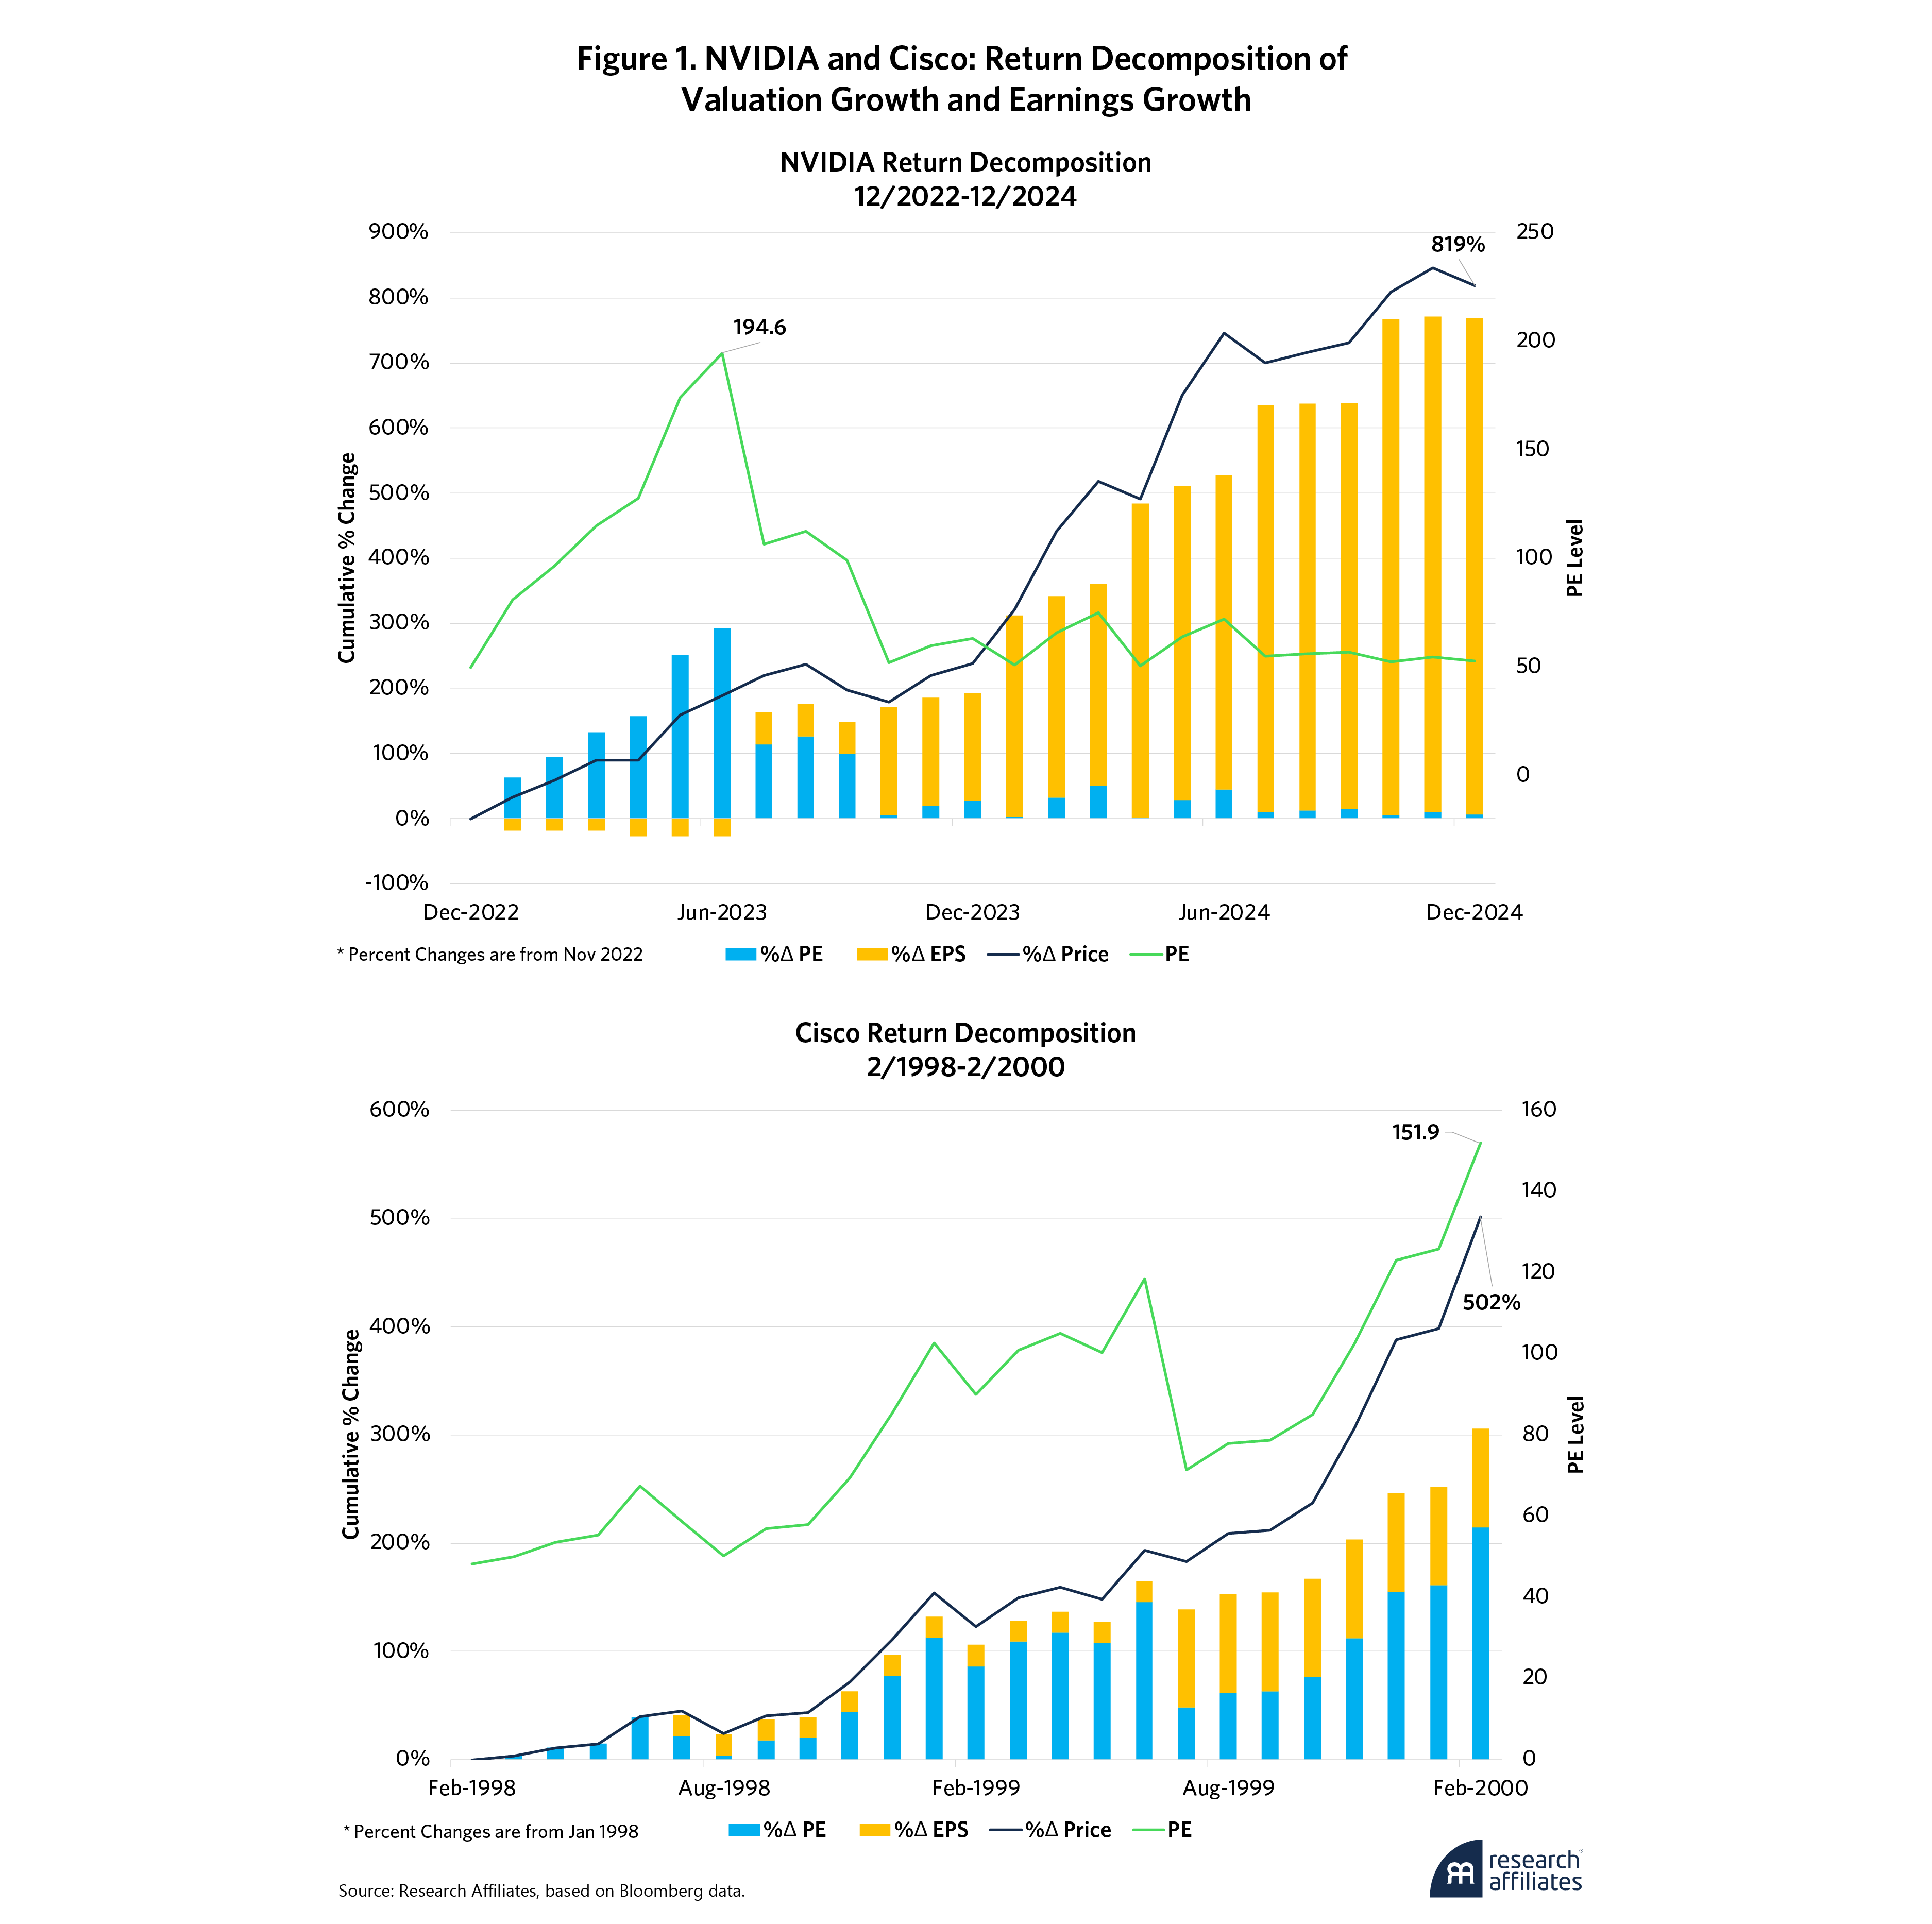
Of course, parallels aside, NVIDIA and Cisco diverge in critical ways. Figure 1 shows Cisco’s price decoupled from its fundamentals during the dot-com bubble. By March 2000, Cisco had a price-to-earnings (PE) ratio of 196.2. But then its price and PE collapsed along with the dot-com bubble. Twenty-five years later, Cisco’s market cap has yet to recover.
In recent years, NVIDIA’s stock price has experienced a similarly meteoric trajectory, but unlike Cisco, NVIDIA’s earnings have risen along with its share price. In 2023, the company’s quarterly revenue doubled year over year, reducing its PE ratio from more than 194 in June 2023 to a less oxygen-deprived 72 a year later. NVIDIA finished 2024 with a PE just above 50. While we are not alarmed by a PE of 50, we are troubled by a price-to-sales ratio over 25.5
To justify its current valuation, NVIDIA would have to almost double its economic impact relative to the broader market in the coming years. That may be a reasonable target, if we discount the near-certainty that competition will eat into NVIDIA’s stupendous pricing power, market share, and profit margins. Such unmitigated success stories are rare, however. Of the Four Horsemen, for example again, only Microsoft has outperformed the S&P 500 since the dot-com peak in 2000, and for that, investors had to wait 18 years.
Success encourages envy, which invites competition. Today’s innovators are tomorrow’s dinosaurs. NVIDIA may be synonymous with cutting-edge GPUs today, but developing startups and other tech leaders will make maintaining that status tomorrow far from easy.6
To be sure, NVIDIA’s soaring fundamentals may have tempered some of the Cisco 2.0 comparisons, but the risks—from emerging challengers, unforeseen technology shifts, and slower-than-expected adoption rates—have not gone away. Look at OpenAI. With ChatGPT, it seemed to have cornered the market for user-friendly AI. Then, the Chinese AI startup DeepSeek sprang out of nowhere with a fully competitive product at less than a tenth of the cost. In response, NVIDIA, Microsoft, and Alphabet, among other tech stocks, all fell. The lesson? Fast-developing sectors riding waves of innovation and optimism are inherently volatile.
Market Concentration
Concentration is another aspect the Four Horsemen and Magnificent Seven eras have in common. As the market narrative gains traction, the leading companies account for a larger share of the total market capitalization.
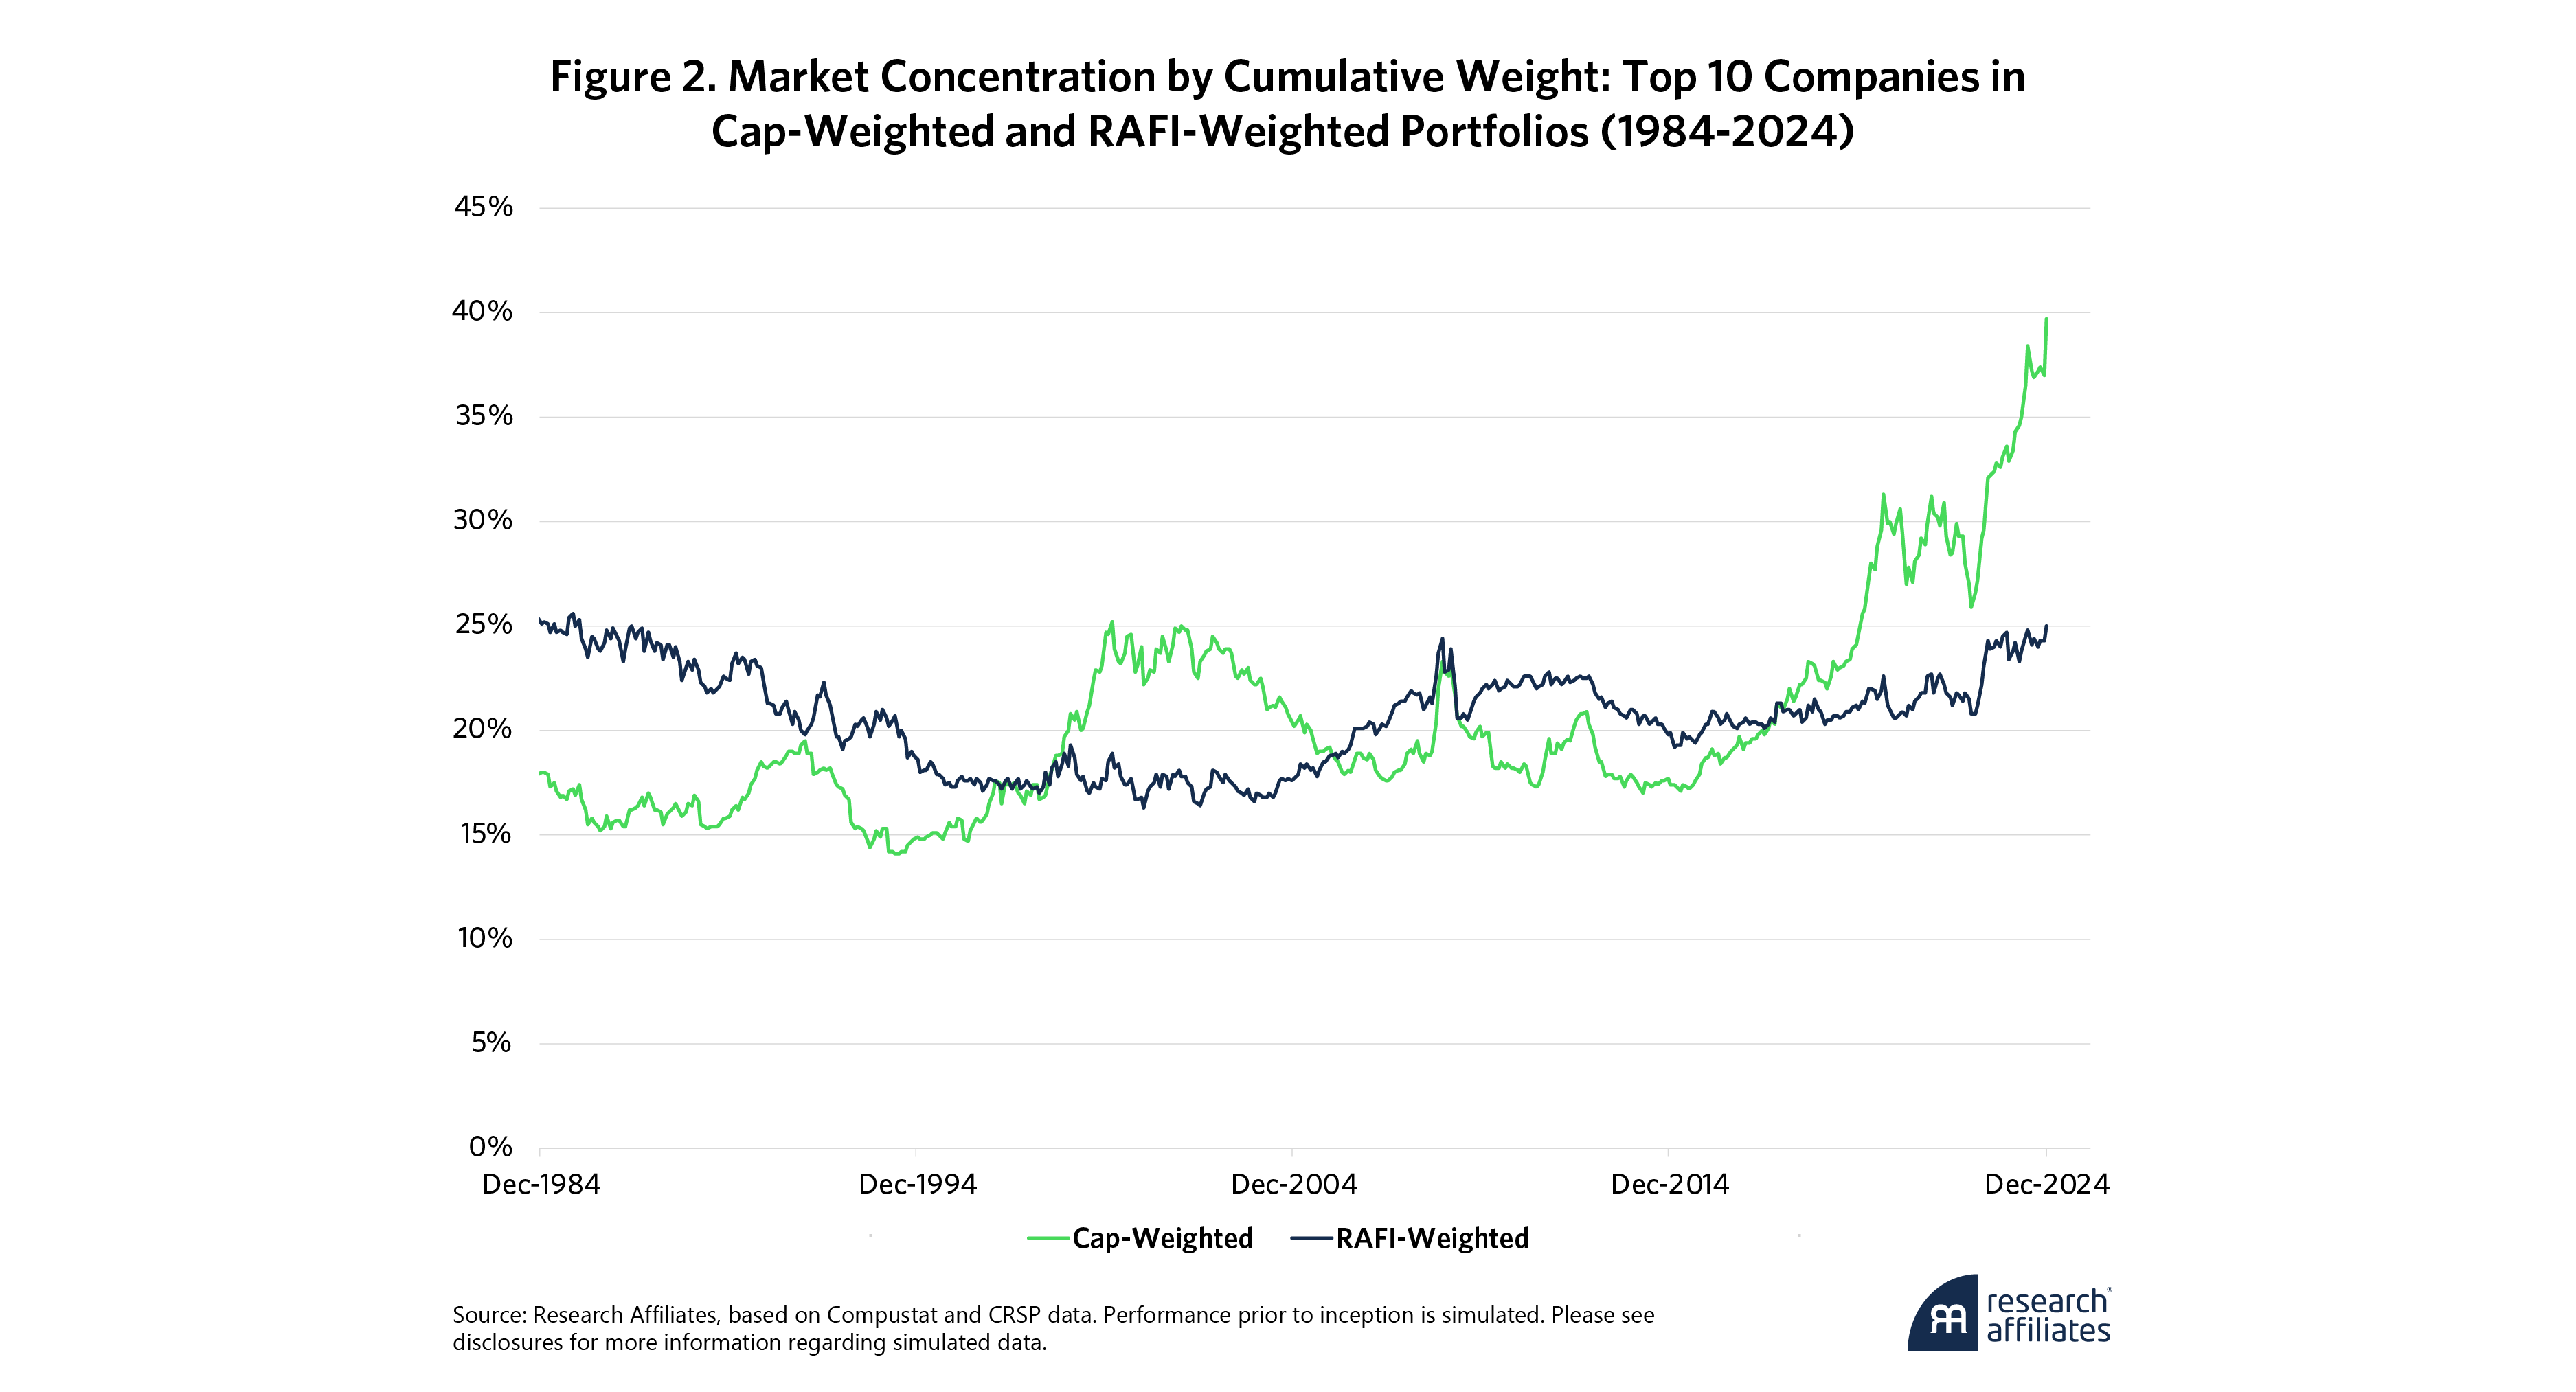
So how do the two periods compare? Figure 2 shows that the 10 largest stocks’ combined market-cap weight at year-end 2024 was nearly 40%. During the dot-com era, it was a then-alarming 25%. By contrast, in the RAFI portfolio, which measures businesses by sales, cashflows, net worth, and dividends plus buybacks, the 10 largest companies at year-end 2024 constituted about a fourth of the economy.
The U.S. economy has changed tremendously in the past 40 years. Not one of the 10 largest U.S. businesses in 1984 is still on the list in 2025. Yet the U.S. macroeconomy remains as well diversified as it was 20 or 40 years ago. As a result, in terms of aggregate economic size, the 10 largest U.S. companies have remained far more stable—and far less concentrated—than the cap-weighted stock market, comprising anywhere from 17% to 25% of the publicly traded macroeconomy. The 10 most valuable U.S. stocks, on the other hand, have accounted for between 14% and 40% of the U.S. stock market.
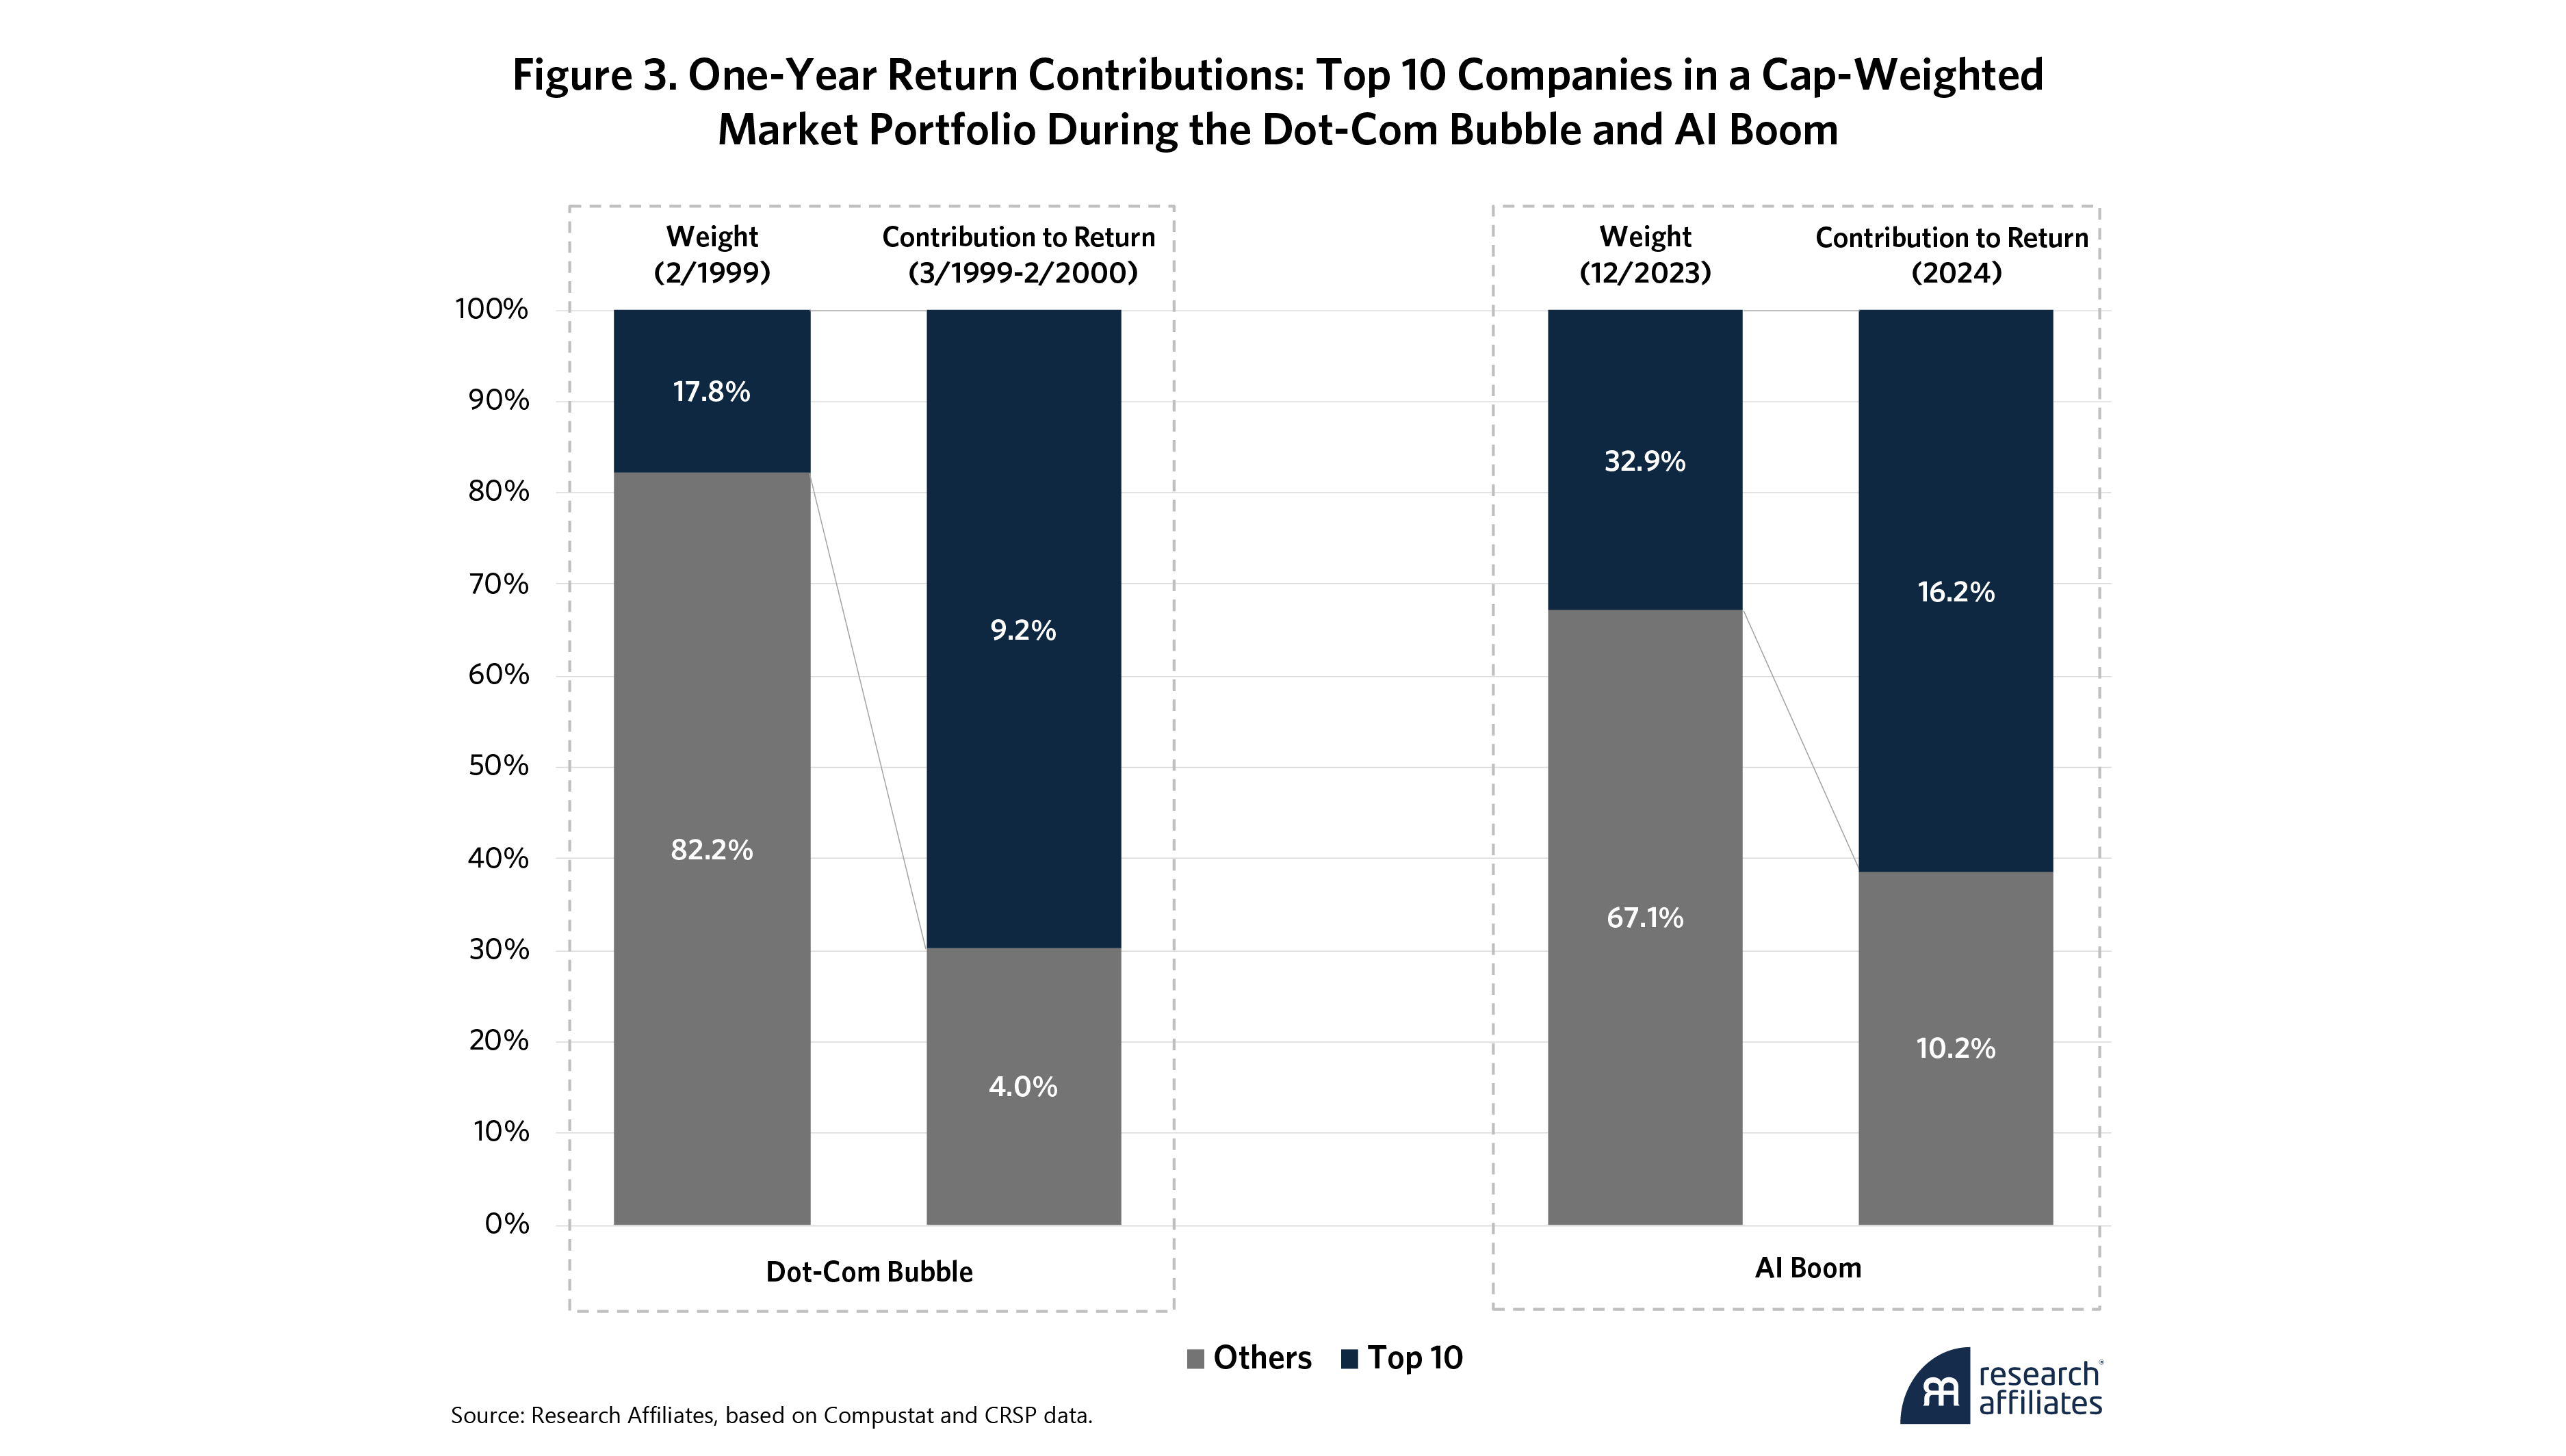
The increased concentration of the cap-weighted portfolio reflects the oversized impact of the Magnificent Seven and Four Horsemen, among the other big names, during their respective narrative cycles. It also demonstrates how the market becomes more and more dependent on these companies maintaining their performance the deeper the cycle goes. Figure 3 shows that the top 10 stocks by market capitalization during the AI boom accounted for more than 60% of the market portfolio's 26% total return in the 12 months to December 2024. During the dot-com bubble, the top 10 names generated nearly 70% of the 13% total market return.
The high concentration of the largest names underscores the parallels between 2000 and today. But the two eras are distinct in another important respect: earnings contributions. The top 10 stocks at year-end 2024 accounted for 28.8% of total market earnings compared to just 16.1% in 2000. Might this mitigate the market concentration concerns? Perhaps. The top companies of the AI era do seem to have more substantial fundamental support than their counterparts did nearly a quarter century ago.
To assess the valuation premiums of the 10 largest stocks by concentration, we calculate a pseudo PE share ratio for both the top 10 stocks and the rest of the market by dividing each segment’s market cap share by its earnings share. At the dot-com bubble’s peak, the top 10 held 25.3% of market cap but only 16.1% of earnings, yielding a relative PE of 1.57. The rest of the market had a 0.89 relative PE, or (1 – 25.3%) / (1 – 16.1%). The top 10 were priced at a 76% relative PE premium compared to the rest of the market. At year-end 2024, the top 10 stocks had a 1.38 relative PE (39.7% of total market cap / 28.8% of the total earnings) and the rest of the market 0.85. So the top 10 stocks were priced at a 62% premium.
Clearly, the top dot-com bubble stocks had more optimism baked into their stock prices and were less reliant on current profits than their successors in today’s AI-fueled market. That said, the significant concentration in valuations among the largest names continues to echo the imbalances seen during the dot-com era. These parallels underscore the persistent risks of excessive dependence on a handful of dominant companies.
Valuation Spread between Top Names and Market Portfolio
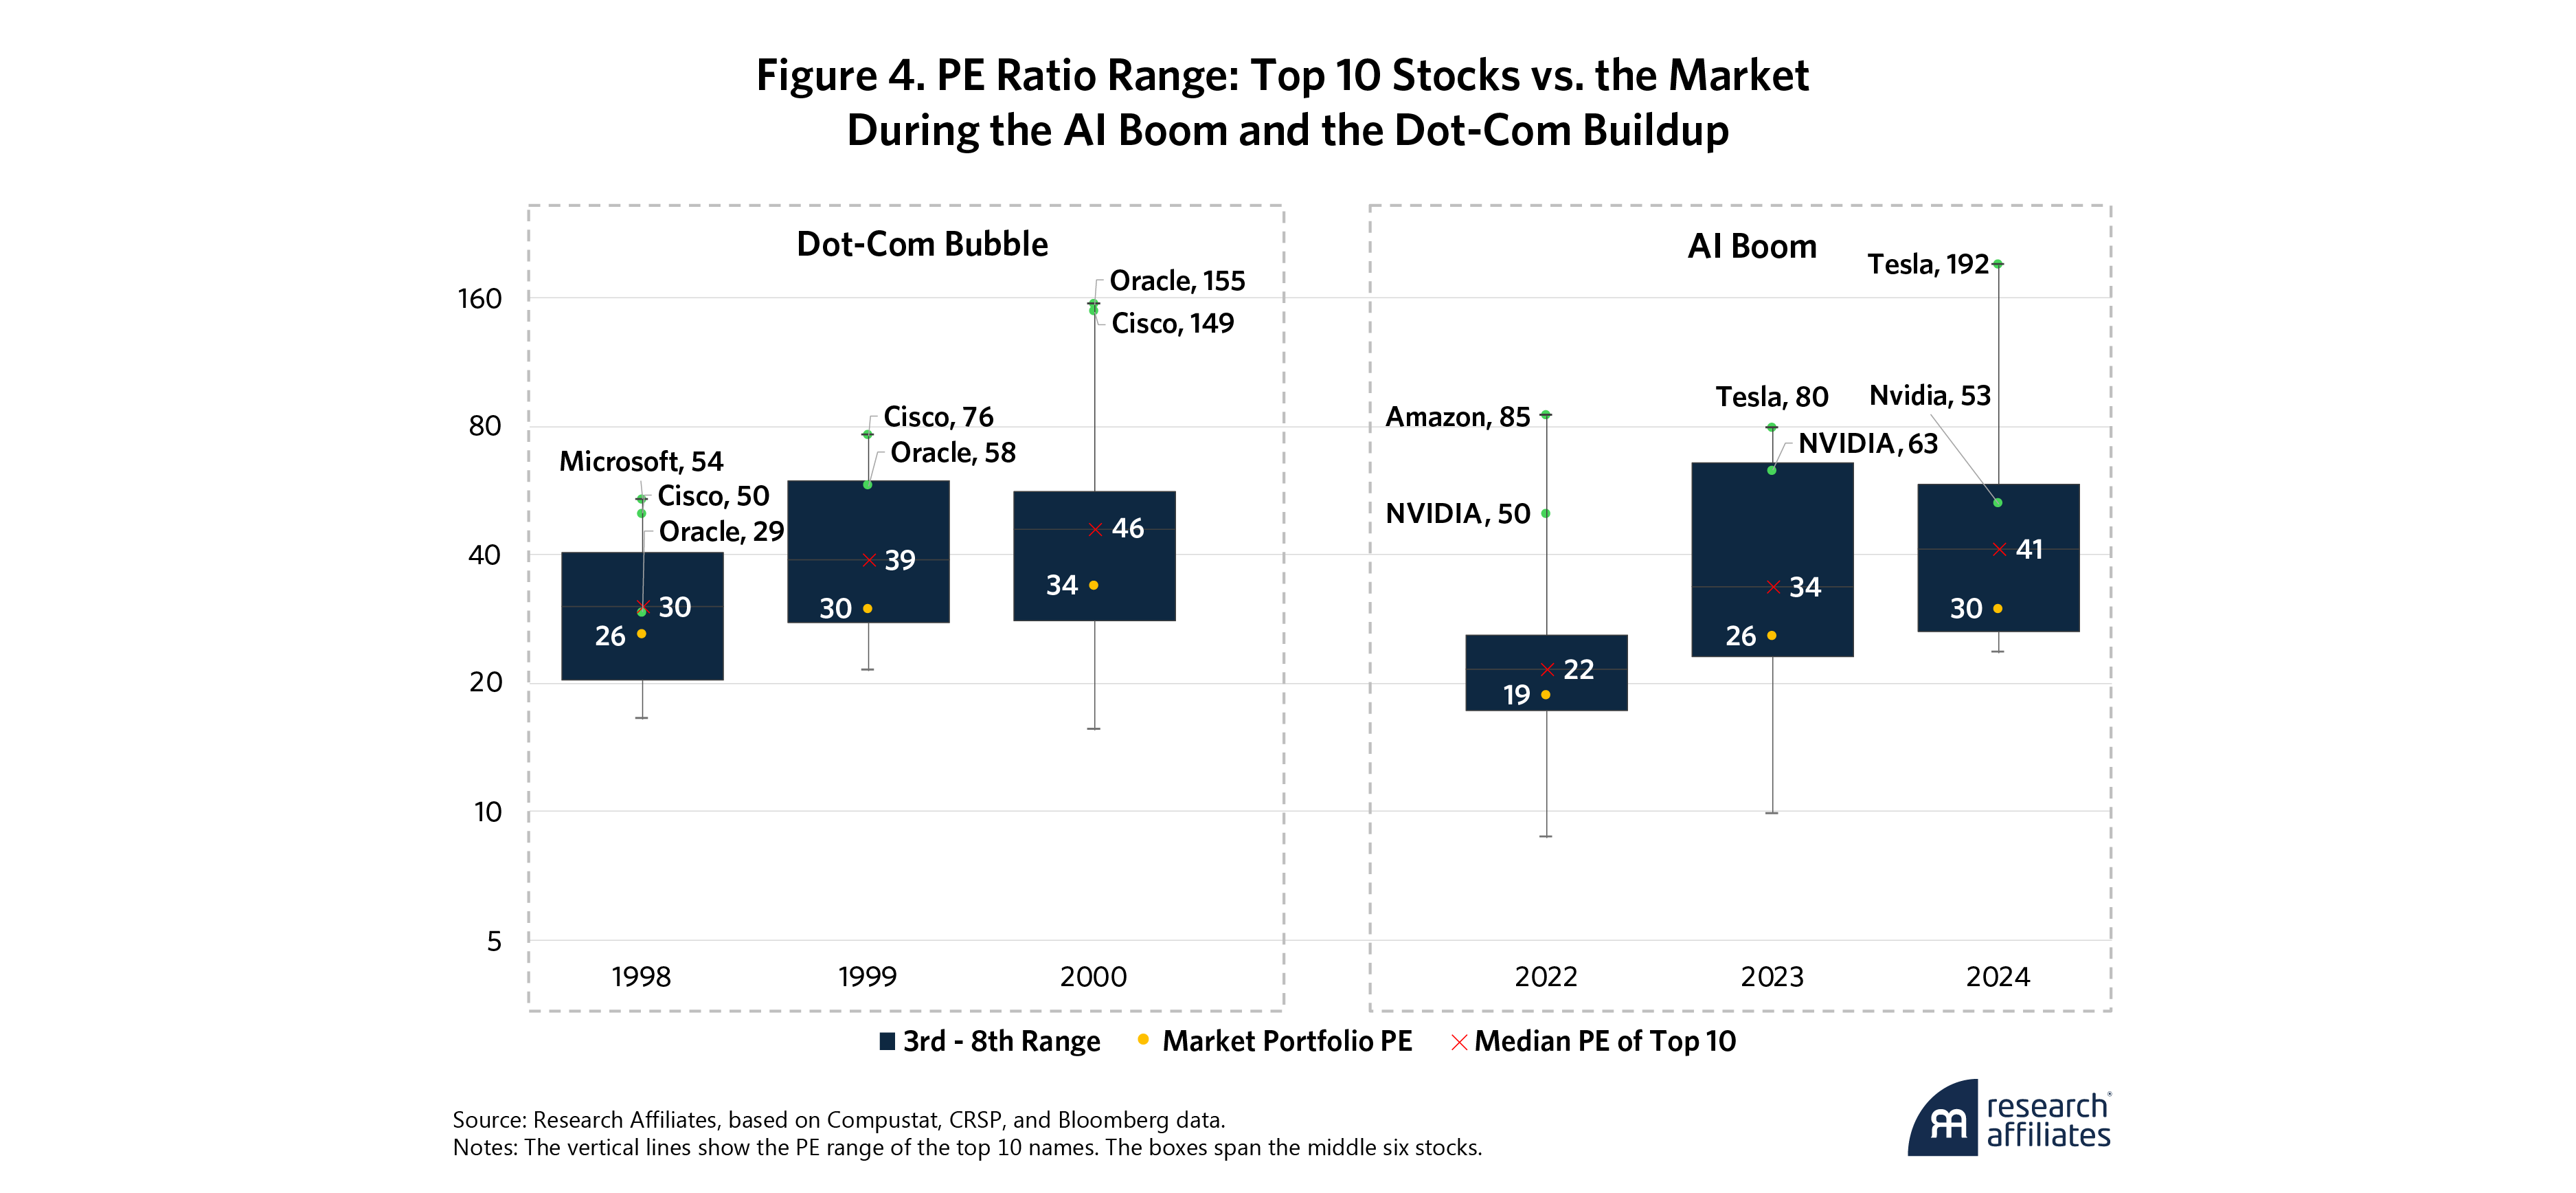
When market performance is dominated by just a few companies, it can create a compounding effect. As the valuations of these stocks rise, their underlying fundamentals struggle to meet ever-growing expectations, so the valuation spread between the big names and the wider market widens despite their already significant weights. Figure 4 shows how this phenomenon plays out.
In early 1998, Oracle and Cisco had PEs of 29 and 46, respectively, compared to 26 for the market as a whole. Over the next two years, the market’s PE rose to 34 while the PEs of the two tech bellwethers surged to extremes in the 150 range, which made the inevitable correction all the more painful.
Today’s AI-driven Magnificent Seven demonstrate a similar dynamic. They benefit from substantial valuation premiums fueled by investor optimism. While Nvidia’s and Amazon’s earnings, for example, have kept pace with their share price appreciation, they still trade at elevated multiples. Indeed, Figure 4 shows how the market’s PE grew almost 60%, rising from 19 to 30 between December 2022 and December 2024. However, the PEs of top tech companies rose even more, from a median PE of 22, which was about 15% more expensive than the market, to 41 by 2024. This represents a premium of approximately 35% over the broad market and 62% over the rest of the market, excluding the top 10 names. At the height of the dot-com bubble, the market had a 34 PE, and the top 10 a median PE of 46. The big names had a 36% premium over the broader market.
At the opposite end of the spectrum, value stocks’ relative valuation multiples have declined. Value stocks underperformed growth from 2007 to 2020 even as their fundamentals remained sound. Recent research by Arnott et al. (2023) indicates that income growth for the Russell 1000 Value nearly parallels that of Russell 1000 Growth. In a market dominated by a growth-focused narrative, value stocks have fallen out of favor, and their relative valuations have tumbled.
However, just as prices cannot rise indefinitely, the valuation multiples of the Magnificent Seven also cannot remain elevated forever. Is the recent pullback in tech just a short-term correction or an early sign of a more significant downturn? How many of the Magnificent Seven will ultimately avoid the fate of three of the Four Horsemen remains to be seen. Nonetheless, prevailing valuations suggest that the market has yet to fully appreciate the risks embedded within the AI-driven narrative.
A closer examination of the leading names, their lofty valuations, and the concentrations of their holdings and returns, reveals further insights. Although today's top tech companies demonstrate somewhat stronger fundamentals than their dot-com era predecessors, that doesn’t mean investors should buy the AI-driven hype or ignore the risks of a potential correction reminiscent of the early 2000s. Long-term investors should evaluate their options with care and choose the risk profile that best aligns with their investment strategy.
What’s an Investor to Do?
Say we are indeed in bubble territory. So what? As John Maynard Keynes observed, “The market can stay irrational longer than you can stay solvent.” Bubbles can go further and last longer than anyone might expect. But we don’t have to pick up nickels in front of a steamroller. If the AI market is indeed a dot-com repeat, we could be in the early stages, circa 1997, the salad days of the late 1990s, or right at the edge of the 2000 swan dive.
A bubble’s existence also doesn’t necessarily imply that the companies within it are flawed either. It simply indicates that their current share prices may be unrealistic. These companies may still deserve meaningful allocations, although perhaps not as much as their market caps would suggest.
Say we are indeed in bubble territory. So what? As John Maynard Keynes observed, “The market can stay irrational longer than you can stay solvent.” Bubbles can go further and last longer than anyone might expect. But we don’t have to pick up nickels in front of a steamroller.
”The key to building effective portfolios is mitigating the potential downside after the bubble bursts without sacrificing the real economic value of the underlying narrative. With that in mind, investors have three main “off-the-shelf” approaches to consider.
1. Sink or Swim with Cap-Weight
A market-cap-weighted strategy like the S&P 500 fully embraces the narrative driving the market. That story may hold up in the long run, but the upside potential is probably already reflected in current prices. Which leaves little room for error. At year-end 2024, the Magnificent Seven accounted for 33% of the cap-weighted portfolio. If these bellwether stocks fail to realize their lofty expectations or, like their dot-com era forerunners, don’t realize them quickly enough, the huge gains of recent years may turn into huge losses. Those who invested in a market-cap portfolio just before the dot-com peak did not recover their losses for five years post-bubble. The largest 10 names, which contributed significantly to the cap-weighted portfolio’s returns leading up to the dot-com peak, also accounted for half of its losses when the market crashed. Their large weights at the top amplified their impact during the downturn.
2. Go with Naive Value
So why not avoid the risk and bypass high-flying AI stocks altogether by investing in traditional value strategies? Why pay a premium for popular and potentially overpriced companies when value stocks are available at a discount? The Russell 1000 Value, for example, has no allocation to the Magnificent Seven. Value stocks may underperform at times, but they often deliver higher yields with income growth rates comparable to those of growth stocks.
It is a compelling argument, but such a conservative approach may miss out on other opportunities. Amid powerful market narratives, value stocks can underperform for long periods despite solid fundamentals. Avoiding healthy growth companies may mean the portfolio misses out on long-term growth potential. As inflated as their stock prices were, the Four Horsemen all still contribute to the real economy today.
3. Embrace a Fundamental Index Approach
Instead of fully buying into or tuning out the market hype, you could embrace a fundamental index approach. RAFI filters out excessive speculation—the extremes in either direction—and emphasizes companies and sectors with genuine economic footprint. While speculative bubbles often lead to inflated prices, that doesn’t mean that companies with inflated prices are fundamentally flawed. For example, Qualcomm’s 2600% price surge may have been powered by speculation, but the company still helped advance internet technology and continues to this day.
Instead of fully buying into or tuning out the market hype, you could embrace a fundamental index approach. RAFI filters out excessive speculation—the extremes in either direction—and emphasizes companies and sectors with genuine economic footprint.
”RAFI uses four fundamental measures: current book value adjusted for intangibles, five-year trailing-average sales adjusted for the company’s equity-to-asset ratio, five-year trailing-average cash flow plus the company’s R&D expenses, and five-year trailing-average dividends plus share buybacks. Unlike the market-cap-weighted strategy, this approach protects the portfolio from the risks that emerge when stock prices detach from the fundamental reality. But unlike the naive value strategy, RAFI also recognizes the potential of narrative-driven companies. So it can still capture their economic significance and future potential without getting too caught up in the hype. As of year-end 2024, the combined weight of Magnificent Seven stocks in RAFI was 20.2 percent compared with 33.0% in a cap-weighted index—nearly 40% less in relative terms.
Figure 5 shows how the three strategies—cap-weighted core market, naive value, and RAFI—fared during the dot-com bubble, the pandemic, and the current AI-driven market.
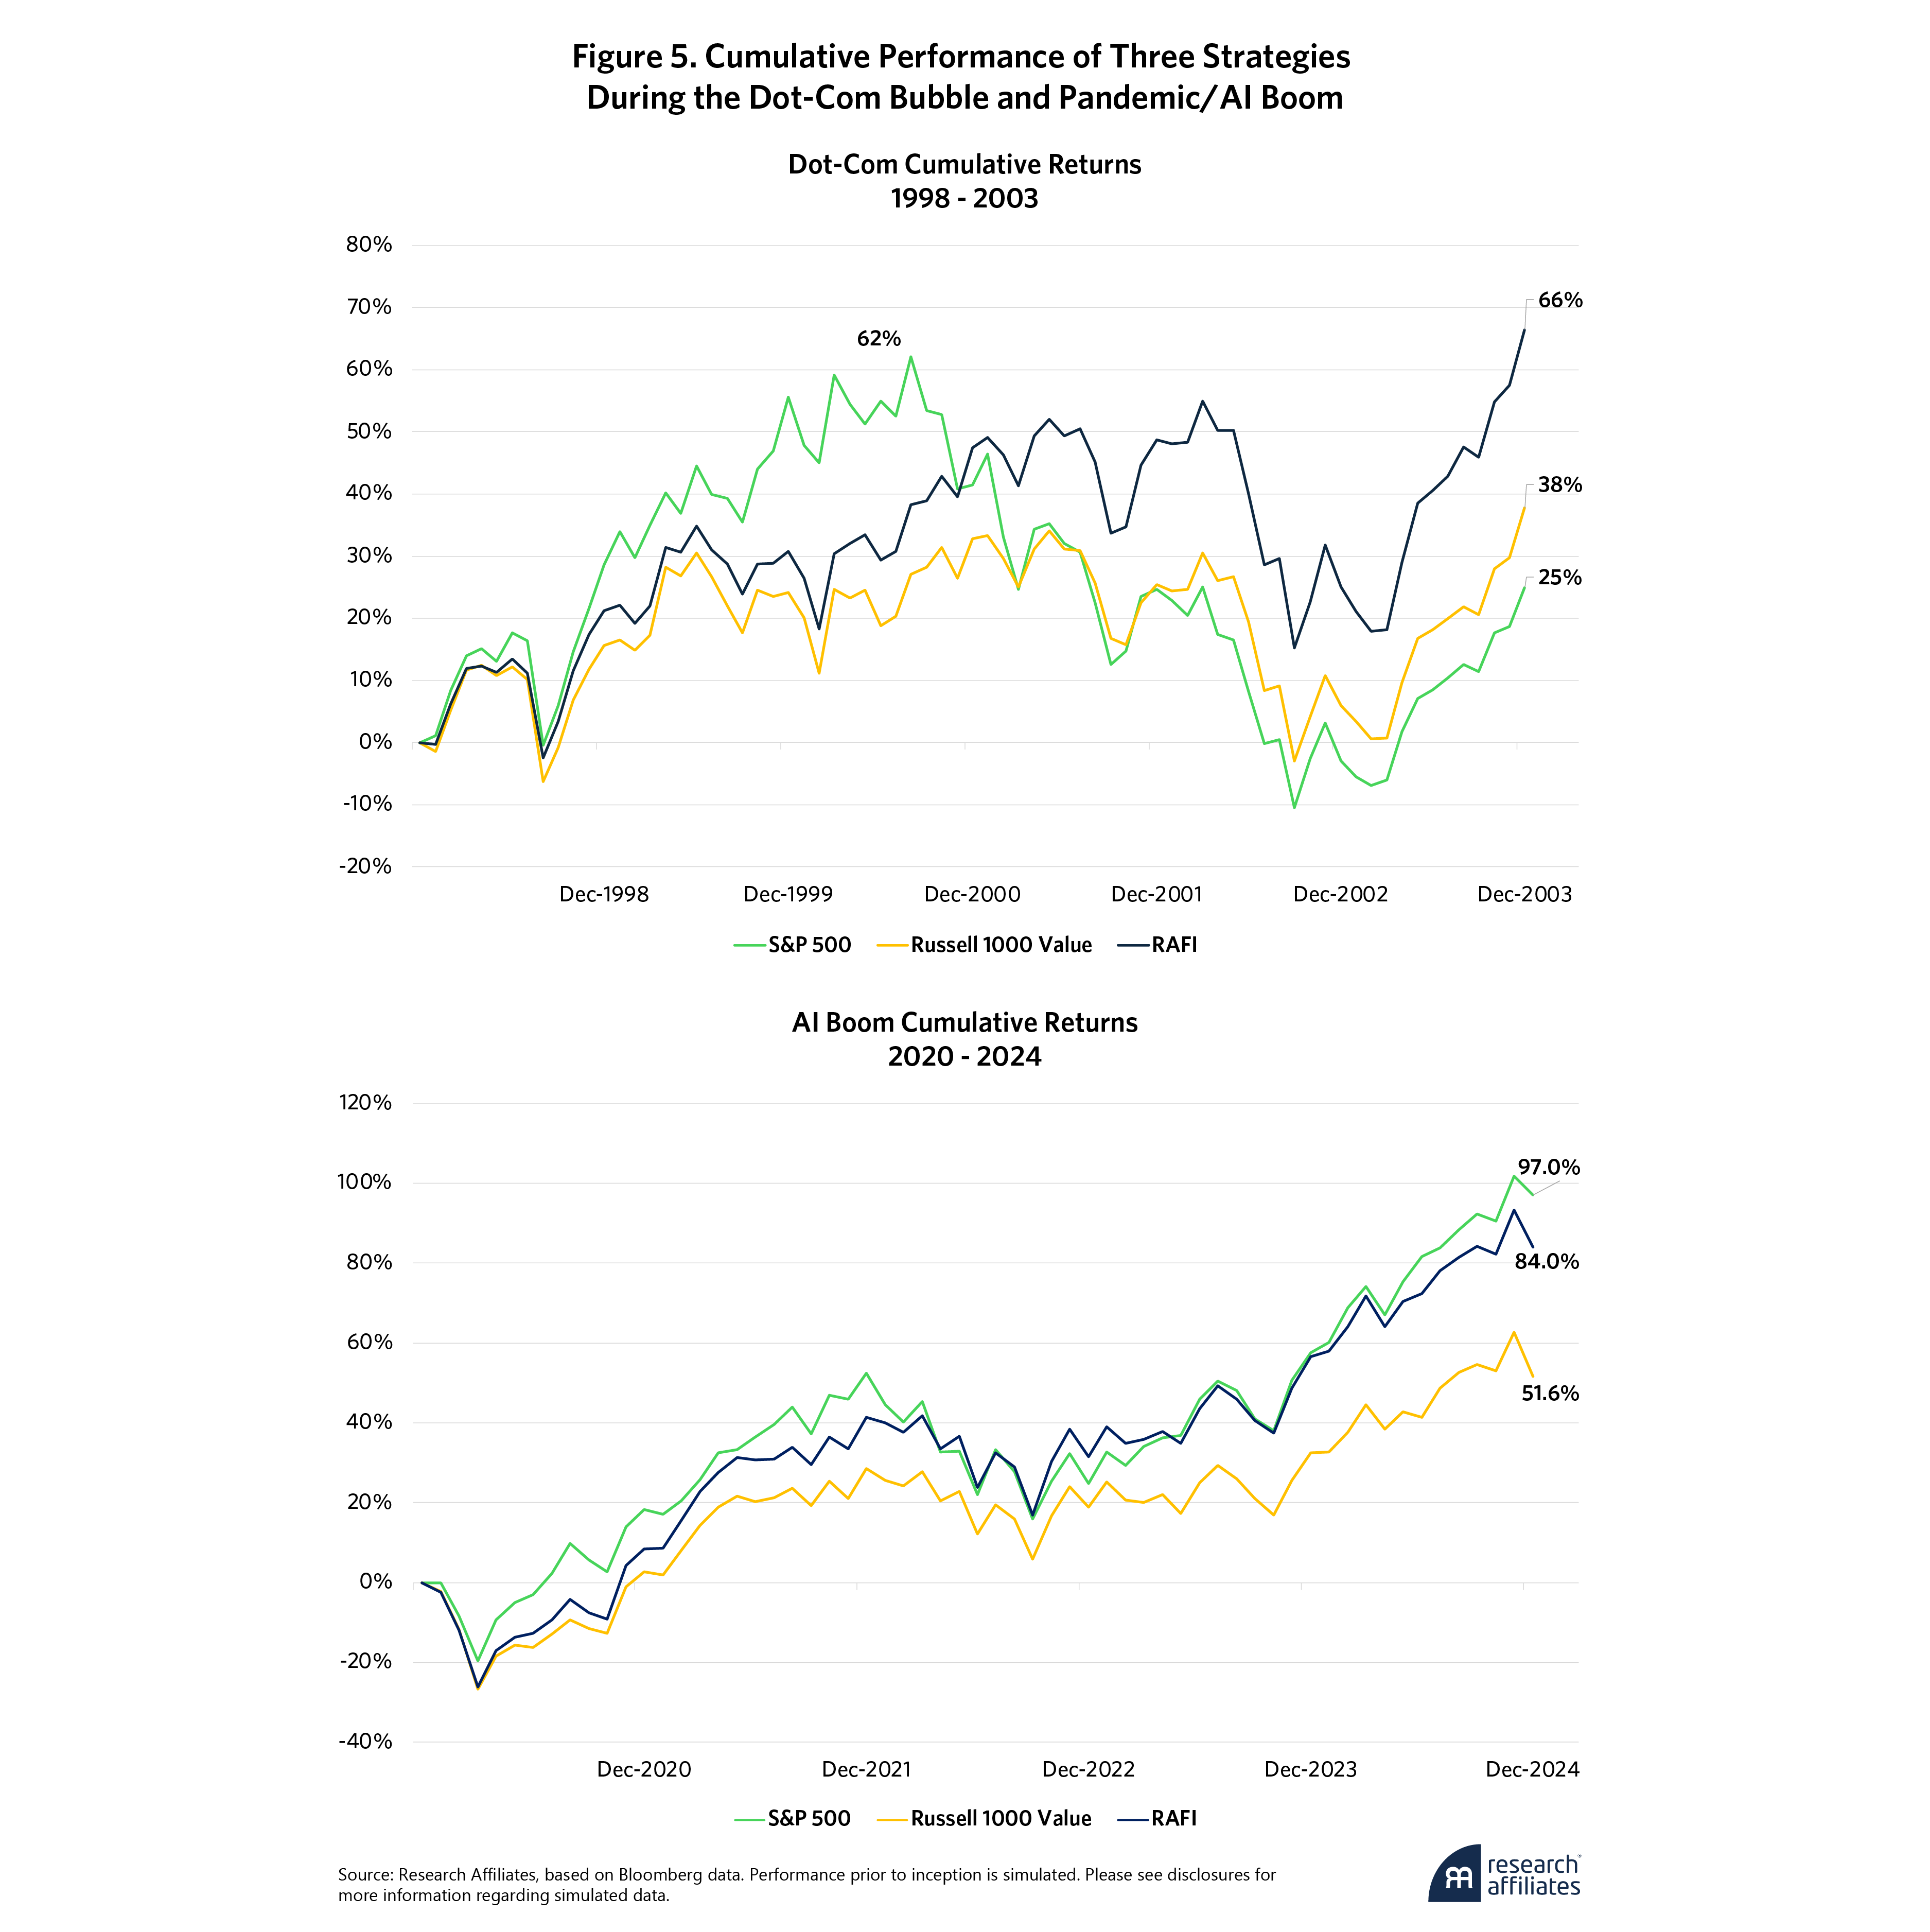
The top chart shows how over the first two years of the dot-com bubble, the cap-weighted S&P 500 outperformed RAFI and the Russell 1000 Value, peaking at 62% cumulative returns in 2000 thanks to its high concentration of rapidly appreciating tech stocks during the buildup phase. Of course, it also experienced the largest drawdown when the bubble burst. Over the six-year sample, RAFI provided a much smoother trajectory, and its 66% cumulative returns exceeded the 25% and 38%, respectively, of the cap-weighted and value index.
Figure 5’s bottom panel shows how these strategies fared amid the pandemic value crash and the current AI boom. From 2020 to 2024, RAFI closely tracked the bullish S&P 500 through Q1 2024 before lagging in late 2024 amid the rising dominance of the Magnificent Seven. All told, amid horrific value headwinds, RAFI trailed the S&P 500 by 13% over the past five years but outperformed the Russell 1000 Value by more than 32%.
Of course, maybe RAFI’s performance was simply the product of fortuitous timing. To test that hypothesis, we conducted a “horse race” experiment over various five-year investment horizons, initiating investments throughout the market cycle. Why five years? Because that’s roughly the limit of the average stock investor’s patience. Figure 6 shows the outcomes of nine different five-year investment windows bookended by the brilliant bull runs of 1995 to 1999 and 2003 to 2007 to avoid overlap with the global financial crisis (GFC). All the intervening five-year spans include both bull and bear markets.
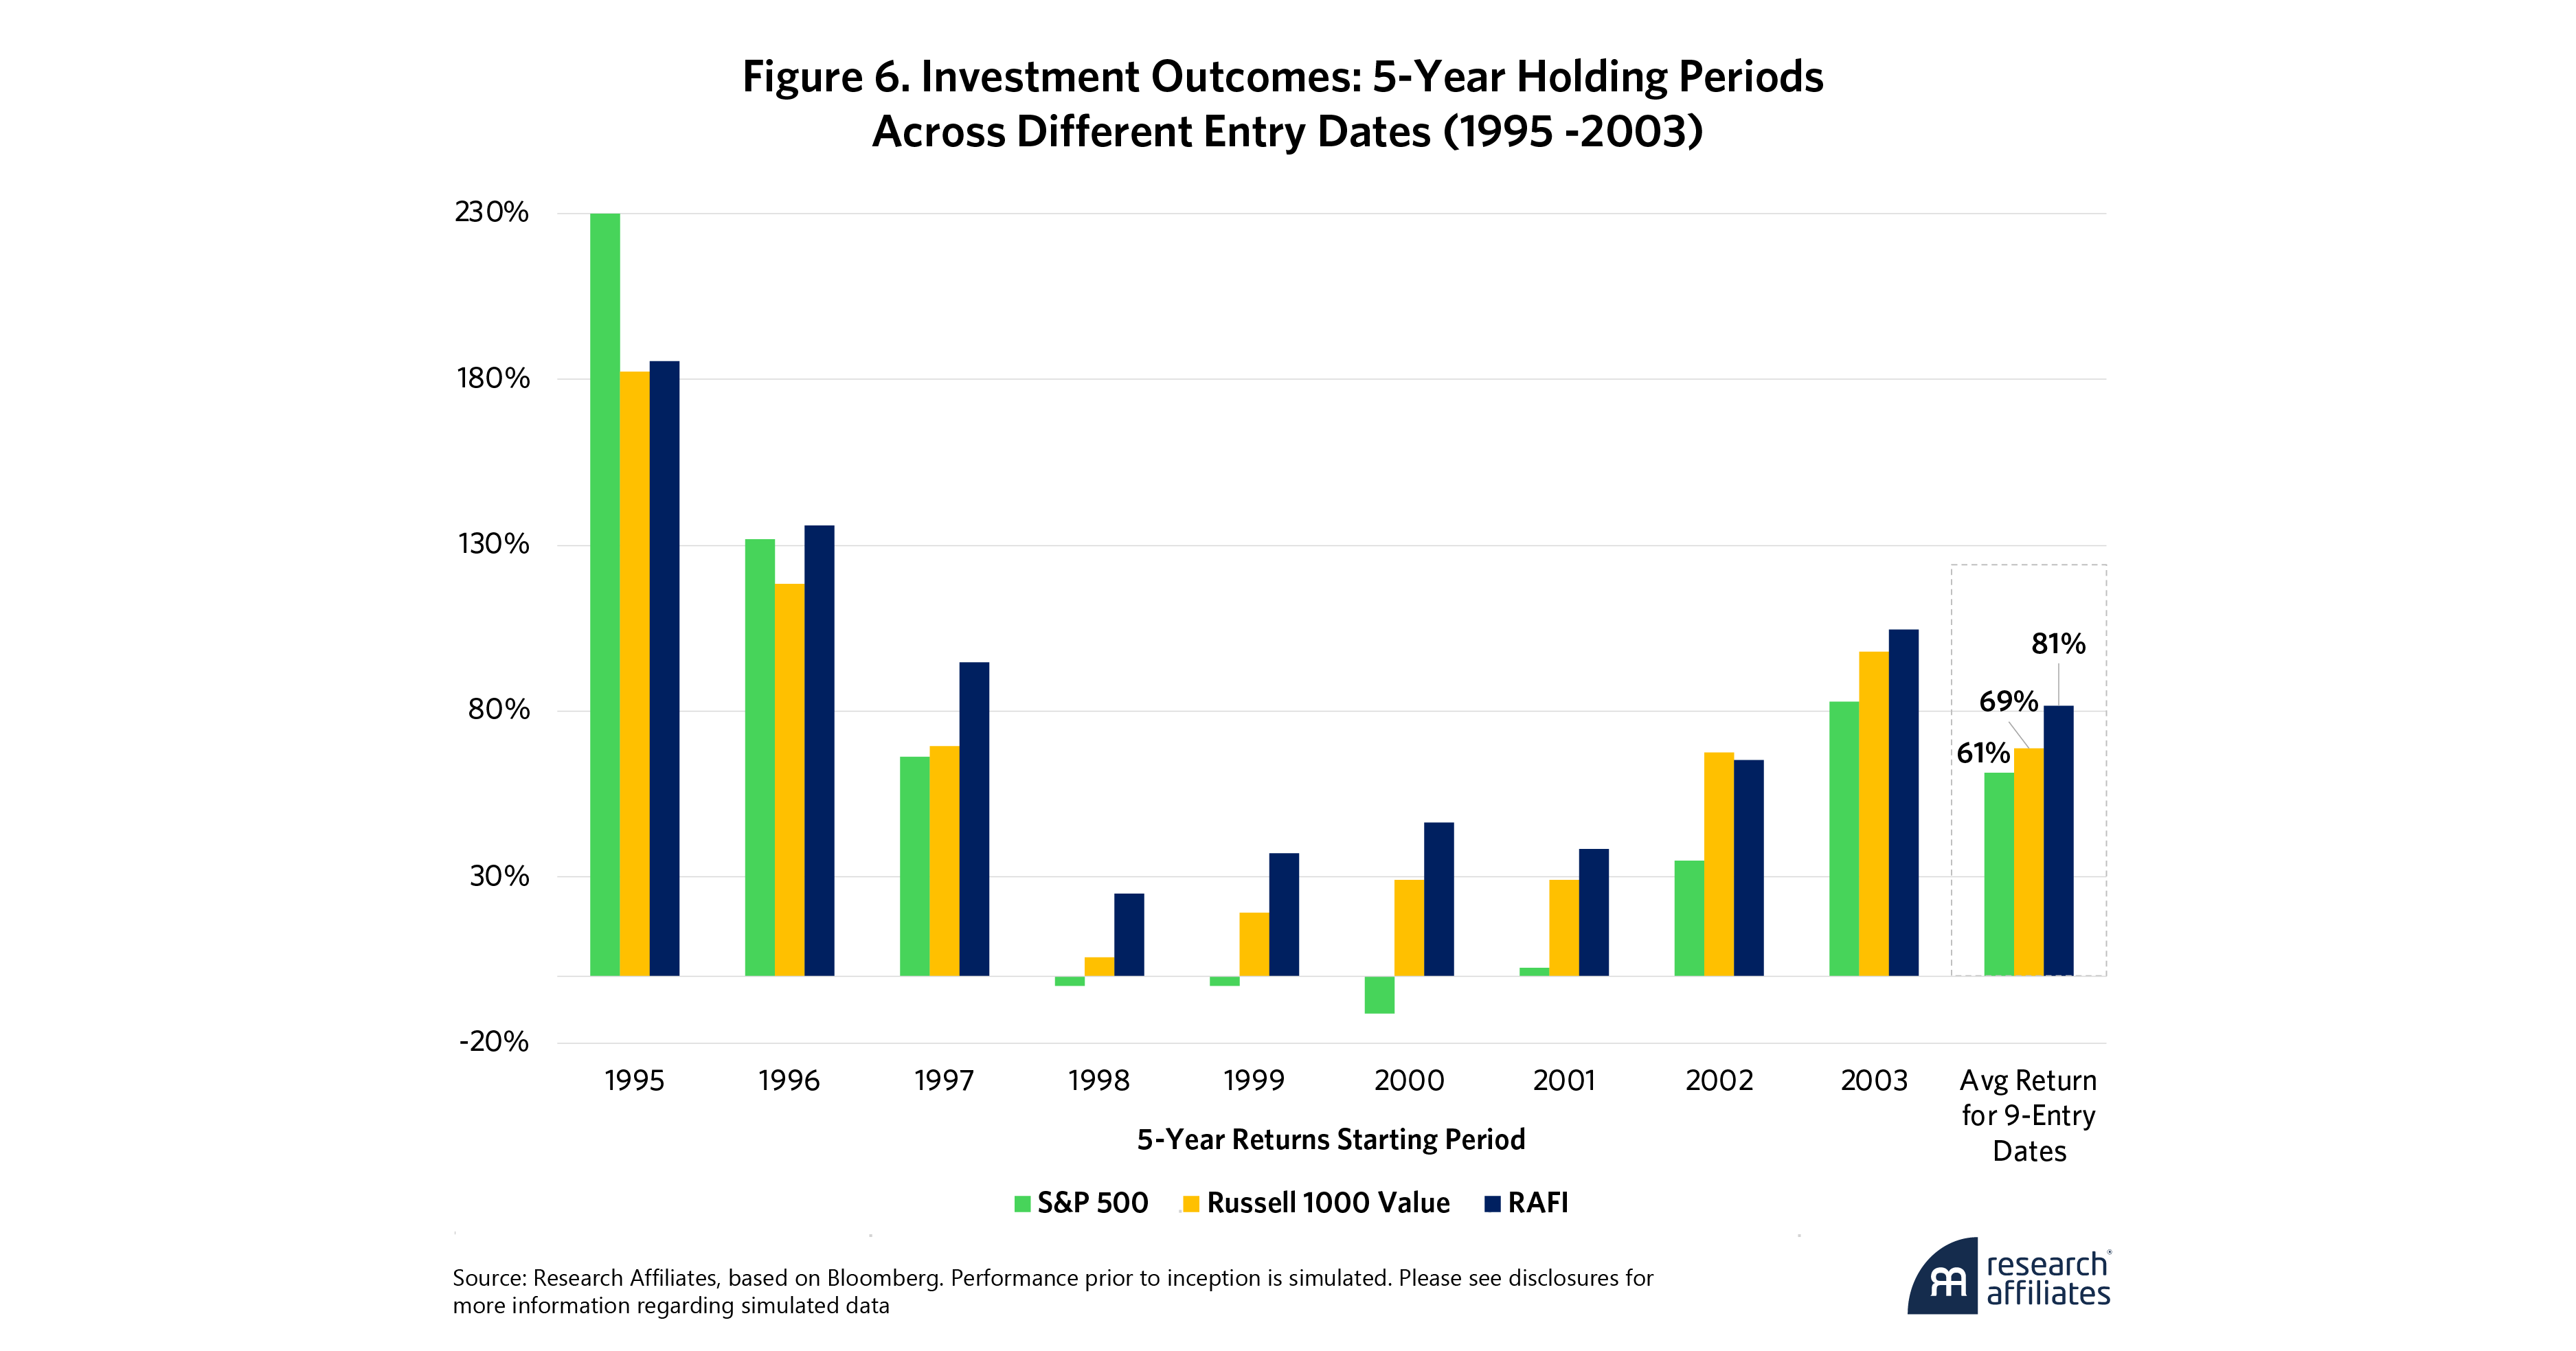
The S&P 500 came out on top in the first five-year span. As the dot-com bubble developed and rapidly inflated, the market-cap portfolio surged and growth reached unprecedented valuation multiples. But then the bubble deflated and burst, and the market-cap portfolio remained underwater for more than five years. This decline is worth keeping in mind amid the current AI narrative.
The Russell 1000 Value only beat the S&P 500 and RAFI during the 2002-to-2006 interval. RAFI came out ahead in seven of the nine five-year periods. So RAFI’s balanced approach, holding narrative stocks at economically realistic and fundamentals-based weights rather than overweighting or avoiding them altogether, would have served investors well.
Across the nine starting dates and spanning the entire tech bubble from buildup through crash through recovery, RAFI delivered an average five-year return of 81%, compared with only 61% and 69% for the traditional cap-weighted and value index, respectively. RAFI ably navigated the speculative cycles while maintaining its exposure to meaningful economic growth.
Conclusions
However closely the AI market narrative mirrors the dot-com bubble, it will unfold in its own way and on its own timeline. The future is inherently unpredictable. And if the AI boom is a bubble, we cannot accurately anticipate where we are in that cycle. Is the bubble still inflating, nearing its peak, or about to pop? Nobody knows. While the dot-com-era parallels provide some insights, they still offer only a partial view.
But effective investing does not require precise forecasting. Navigating the AI narrative, or any narrative, is not so much about relying on an investment strategy as adopting an investment philosophy. By weighting companies based on their real economic impact, RAFI does exactly that. It embraces a balanced approach between the extremes of traditional value strategies by avoiding the high narrative-driven stocks entirely, and the speculative, all-in approach of market-cap weighting.
Narratives fuel markets. But how—and when—the story ends is always uncertain. Amid the unanswered questions of the AI era, RAFI offers a resilient framework that positions portfolios to weather whatever ups and downs lie ahead.
Narratives fuel markets. But how—and when—the story ends is always uncertain. Amid the unanswered questions of the AI era, RAFI offers a resilient framework that positions portfolios to weather whatever ups and downs lie ahead.
”Please read our disclosures concurrent with this publication: https://www.researchaffiliates.com/legal/disclosures#investment-adviser-disclosure-and-disclaimers.


End Notes
1. AI will also create millions of similarly high-skill white-collar jobs and increase the value of AI-related knowledge and expertise.
2. See Aschenbrenner, Leopold. “Situational Awareness: The Decades Ahead,” situational-awareness.ai, June 2024. A cofounder of OpenAI, the developer of ChatGPT, Aschenbrenner paints an inspiring but disquieting picture of AI’s future. He advocates for an AI Manhattan Project, managed and funded by the US government, to ensure the United States continues to lead AI’s evolution rather than ceding the role to potentially dangerous competitors. According to Aschenbrenner’s calculations, to maintain its dominance in the space through 2027, the United States will need to dedicate 40% of its electricity to the task. That means the capacity of the US electric grid will have to grow by 40% in three years. We are alarmed by Aschenbrenner’s advocacy of government control of the process.—that might be the path our geopolitical rivals take, but it must not be ours. We do believe, however, that Aschenbrenner’s vision of AI’s future is likely quite prescient, though his timeline is far too optimistic. Developments that he estimates will take three years will probably take 10 or 15.
3. Noel Randewich and Ankika Biswas. “Nvidia eclipses Microsoft as world's most valuable company.” Reuters, June 18, 2024.
4. Lewis Krauskopf. “Echoes of dotcom bubble haunt AI-driven US stock market.” Reuters, July 1, 2024.
5. Spencer Jakab. ’What Were You Thinking?’ The Dot-Com Boom Peaked 25 Years Ago Today.” The Wall Street Journal, March 10, 2025. Sun Microsystems cofounder Scott McNealy describes the implications of his own company’s peak stock price during the dot-com bubble as follows: “At 10 times revenues, to give you a 10-year payback, I have to pay you 100% of revenues for 10 straight years in dividends. That assumes I can get that by my shareholders. That assumes I have zero cost of goods sold, which is very hard for a computer company. That assumes zero expenses, which is really hard with 39,000 employees. That assumes I pay no taxes, which is very hard. And that assumes you pay no taxes on your dividends, which is kind of illegal. And that assumes with zero R&D for the next 10 years, I can maintain the current revenue run rate. Now, having done that, would any of you like to buy my stock at $64? Do you realize how ridiculous those basic assumptions are? You don’t need any transparency. You don’t need any footnotes. What were you thinking?”
6. For example, Amazon founder Jeff Bezos recently joined with Samsung to invest almost $700 million in Tenstorrent, an emerging rival to Nvidia, in its latest funding round. Amazon is also developing Trainium chips, which Anthropic will use in future AI applications.
References
Arnott, Rob, Chris Brightman, and Thomas Verghese. “The NVIDIA/AI Singularity: Breakthrough, Bubble, or Both.” Research Affiliates, September 2023.
Arnott, Rob, Bradford Cornell, and Shane Shepherd. “Yes. It’s a Bubble. So What?” Research Affiliates, April 2018.
Arnott, Rob, Brent Leadbetter, and Que Nguyen. “RAFI Rocks!! Taking Smart Beta Back to Basics.” Research Affiliates, February 2023.
Cornell, Bradford, and Aswath Damodaran. “The Big Market Delusion: Valuation and Investment Implications.” Financial Analysts Journal 76 (2):15–25.
Krauskopf, Lewis. “Echoes of Dotcom Bubble Haunt AI-Driven US Stock Market.” Reuters, July 1, 2024.
