
The widespread use of total tracking error as a measure of risk is one of the most significant errors in investment management.
In reality, investors seek only to avoid downside volatility while they are pleased to benefit from upside volatility.
Investment practitioners would benefit from an effective methodology to mitigate downside risk, retain upside volatility, and improve overall outcomes for investors.
Research Affiliates Downside Tracking Error Control (RADTEC) is a dynamic risk management framework that seeks to produce higher expected returns by reducing downside volatility.
Volatility is a problematic measure of risk, yet it is widely used as a standard risk metric for investment management. When applied to portfolio managers in the form of tracking error to a benchmark, the concept of volatility becomes even more problematic. In fact, the widespread adoption of tracking error as a measure of risk is one of the most significant errors in the practice of finance.
The problem with tracking error in practice is very simple. Investors only care about the downside volatility but are happy to capture upside volatility. A better method is needed for investment practitioners. What if managers could mitigate downside risk and still capture upside gains?
Create your free account or log in to keep reading.
Register or Log in
That’s why we developed the Research Affiliates Downside Tracking Error Control (RADTEC) framework. RADTEC is designed to minimize the chance that downside volatility breaches a target by dynamically managing the active risk between a strategy and its benchmark. When RADTEC is applied to real-world strategies, our analysis shows that downside risk is substantially mitigated, leading to more consistent performance for investors—but not at the cost of lower returns. The mitigation of downside volatility can lead to higher expected returns.
Reframing the Problem
The fact that investors have an asymmetric attitude toward risk is not news. Going back decades, researchers have investigated asymmetric risk management and its potential to enhance risk-adjusted returns. In the original portfolio optimization model of Harry Markowitz (published in 1952), risk is defined as variance, which is a symmetric measure of risk. Any deviation from the mean, whether positive or negative, is squared and thus indistinguishable. But Markowitz acknowledged the limitation of his model and stated that the model was only valid if there was no preference for skewness, which is an asymmetric measure of risk.
By adjusting portfolio exposure primarily in response to downside volatility, investors can better shield themselves from adverse market conditions while still capturing potential gains during favorable periods.
”Over the decades since then, researchers have investigated various ways of dealing with risk in optimization frameworks. More recently, research has focused on volatility-managed portfolios, which are designed to adjust risk exposure based on expected volatility with the goal of improving risk-adjusted returns. Instead of looking at total volatility, we focus on downside volatility. By adjusting portfolio exposure primarily in response to downside volatility, investors may be able to better shield themselves from adverse market conditions while still capturing potential gains during favorable periods.
We designed RADTEC to provide managers with a practical tool for producing better results. The model focuses on downside volatility and on downside tracking error in particular, yet in reducing downside risk, it has historically improved risk-adjusted returns. Another benefit of the framework is its ability to limit prolonged underperformance of a strategy relative to its benchmark. These features combine to offer the potential for a better investor experience. By creating a smoother ride for investors, RADTEC can reduce the likelihood of a poorly timed exit from underperforming active strategies.
Escaping the Tracking Error Trap
Portfolio managers are often evaluated against a specified benchmark. In such cases, risk is usually measured by tracking error, which is the standard deviation of the manager’s excess return relative to the benchmark. This actually works against achieving outperformance. Consider the example of a manager that comfortably beats the benchmark every month. Such a manager will rack up tracking error, but exceeding the benchmark in this case is “good” tracking error. Investors typically care only about “bad” (downside) tracking error. Although most investors would like to minimize the downside tracking error and maximize the upside, the total tracking error as used in practice treats downside and upside equally.
Although most investors would like to minimize the downside tracking error and maximize the upside, the total tracking error as used in practice treats downside and upside equally.
”The RADTEC methodology offers a way to escape from this trap. The framework’s measure of downside tracking error calculates the standard deviation of the excess returns and replaces any positive excess return with a zero. At any point in time, a manager can consider how the next month’s return will impact the downside tracking error budget. If tracking error is comfortably within budget, the position will be full "risk on" (100% allocation to the active portfolio). If tracking error is close to the budget, the conditional distribution of next period’s return will be assessed to determine the mix between the active strategy and the benchmark portfolio. On the other hand, if the tracking error budget has already been breached, the position will be fully "risk off".
How It Works
To demonstrate how the model would work in practice, we apply RADTEC to three factor strategies. The objective of the RADTEC methodology is to manage the active risk of a portfolio versus a benchmark. In application, the framework requires five user-specified inputs and derived variables.
- Evaluation Window and Frequency: Our applications use a 12-month rolling window based on monthly data. However, as with all of the choices below, this window is a user input, and the framework is general enough to apply to even high-frequency data.
- Downside Risk Target: The downside risk target can be a fixed value (e.g., 2% annualized) or a dynamic value, such as a certain percentage of overall volatility. The time-varying choice confers an advantage because the risk budget decreases during times of lower volatility.
- Return Threshold: The return threshold is defined as the excess return next period that would lead to a breach of the risk target over the specified evaluation window. Consider a few examples. Suppose the downside risk target is 2%. If the downside tracking error was 2.1% over the past 11 months, the risk budget has been breached, and the active portfolio therefore will switch to 100% allocation in the benchmark (zero active risk). Now consider a scenario in which the downside tracking error was 1.8% over the past 11 months. The risk budget has not been breached. The question is: What is the (negative) return next month that will lead to a breach of the 2% budget? The answer determines the return threshold. Suppose that number is –1.9% (monthly). Thus, if the 12th-month return (next month’s return) is –1.9%, we will exactly hit the 2% downside tracking error budget. If the return is lower than –1.9%, the budget will be exceeded.
- Probability of a Return at the Threshold: As calculated in our example, a –1.9% return or worse will lead to a breach. To operationalize our method, we need to know the probability that this might occur. If the probability is high, our method will tilt toward the benchmark portfolio. If the probability is low, the method will tilt toward the active portfolio. To calculate this probability, we do not rely simply on the historical distribution of the active portfolio returns. We calculate the “conditional” probability by taking current information into account.
- Weight in Active Portfolio: Given the above information, we are able to calculate the weight in the active portfolio. As already mentioned, if the budget is already breached, the method will retreat to the benchmark asset until the downside tracking error falls below 2%. If the threshold is extremely low (say, –35%), the weight on the benchmark asset will go to zero. In other cases, our technique delivers the optimal mix of the benchmark and active portfolio.
Testing Real-World Applications
The RADTEC framework’s flexibility allows for application across various asset classes and investment styles. To illustrate, we focus on managing the downside risk of large-cap value and growth equity investments relative to the S&P 500. Three strategies are used:
- Risk Managed Value (RMV): This strategy blends the Research Affiliates Fundamental Index (RAFI), a value-oriented strategy, with a cap-weighted index proxy for the S&P 500. By dynamically adjusting the allocation between these two components, RMV aims to capture the potential outperformance of RAFI while mitigating downside risk during periods of value underperformance.
- Risk Managed Growth (RMG): This strategy blends the Nasdaq-100, a growth-oriented index, with the S&P 500. RMG seeks to provide exposure to the high-growth potential of the Nasdaq-100 while managing the downside risk associated with growth investing, particularly during risk-off market environments.
- Value and Growth Opportunities (VGO): This strategy dynamically allocates between RAFI and the Nasdaq-100, exploiting the negative excess-return correlation between value and growth styles. Compared with RAFI or the Nasdaq-100 individually, VGO aims to achieve higher returns than either one by being on the right side of the value/growth trade while still managing downside risk relative to the S&P 500.
As our results below demonstrate, these strategies show the potential for RADTEC to reduce downside tracking error, improve risk-adjusted returns, and mitigate drawdowns, thereby enhancing the investor experience and long-term outcomes.
Risk Managed Value
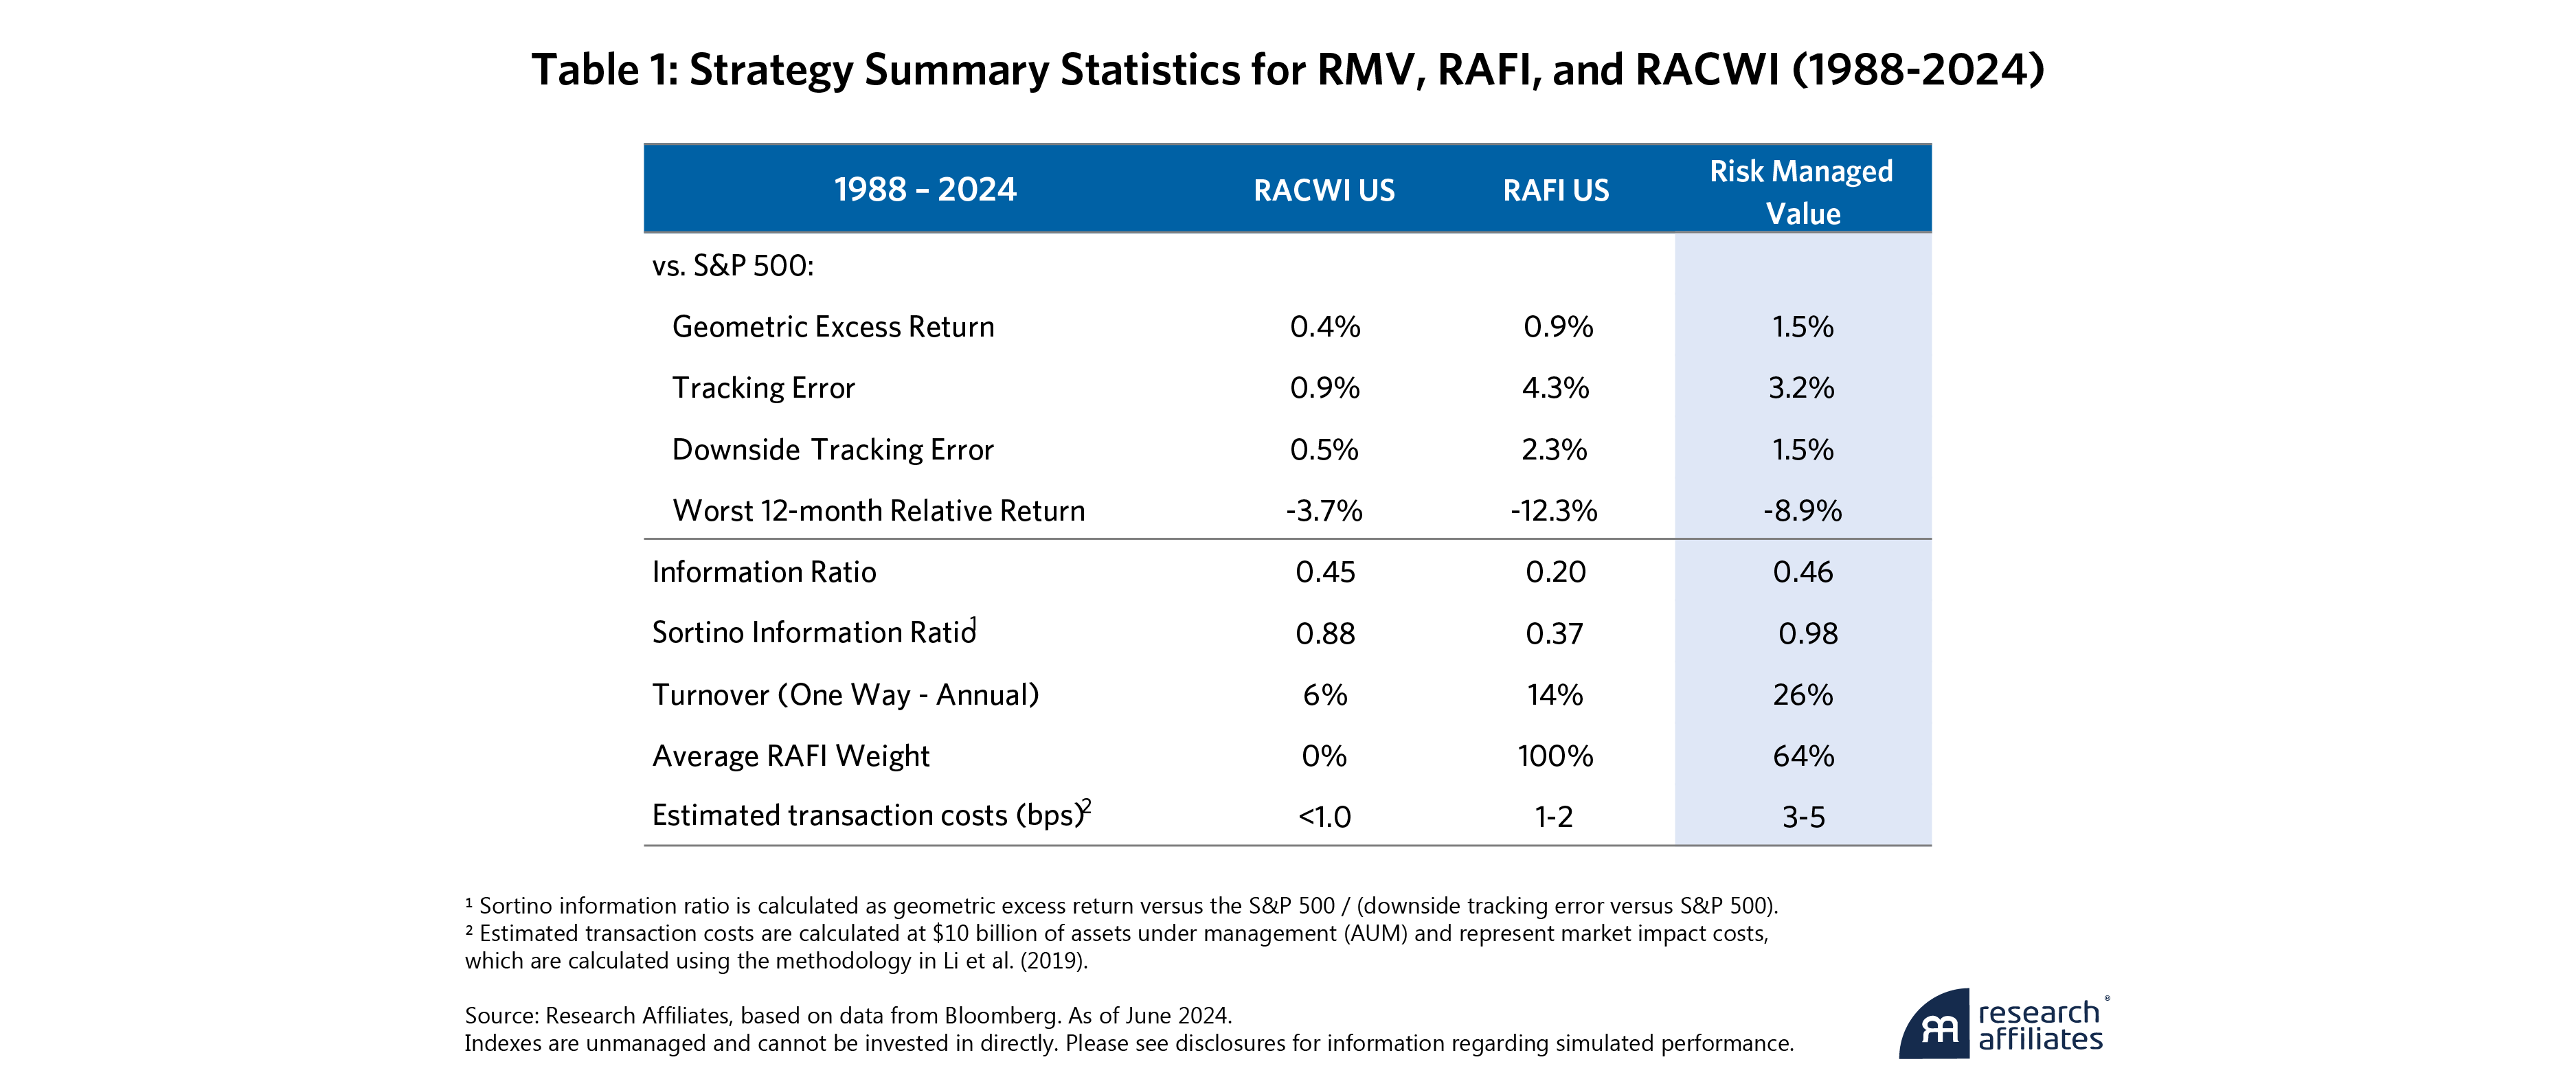
The Risk Managed Value (RMV) strategy blends the Research Affiliates Fundamental Index (RAFI), a value strategy, with the Research Affiliates Cap-Weighted Index (RACWI), a cap-weighted proxy for the S&P 500 with the same constituents as RAFI. The use of RACWI as the benchmark portfolio allows for reduced turnover and improved implementation efficiency compared with using the S&P 500 directly. The results are similar if the S&P 500 is used.
The RADTEC framework's flexibility allows for application across various asset classes and investment styles, making it a potentially valuable tool for investors seeking to navigate the complexities of active management while mitigating downside risk.
”Table 1 shows that the RADTEC Risk Managed Value strategy outperforms RAFI in total return and exhibits lower tracking error and smaller drawdowns relative to the S&P 500. These benefits are achieved with only a moderate increase in turnover compared with RAFI, indicating that the RMV strategy is scalable and implementable. Notably, the Sortino information ratio, defined as the excess return over the benchmark divided by the downside tracking error, is substantially higher for RMV than for RAFI.
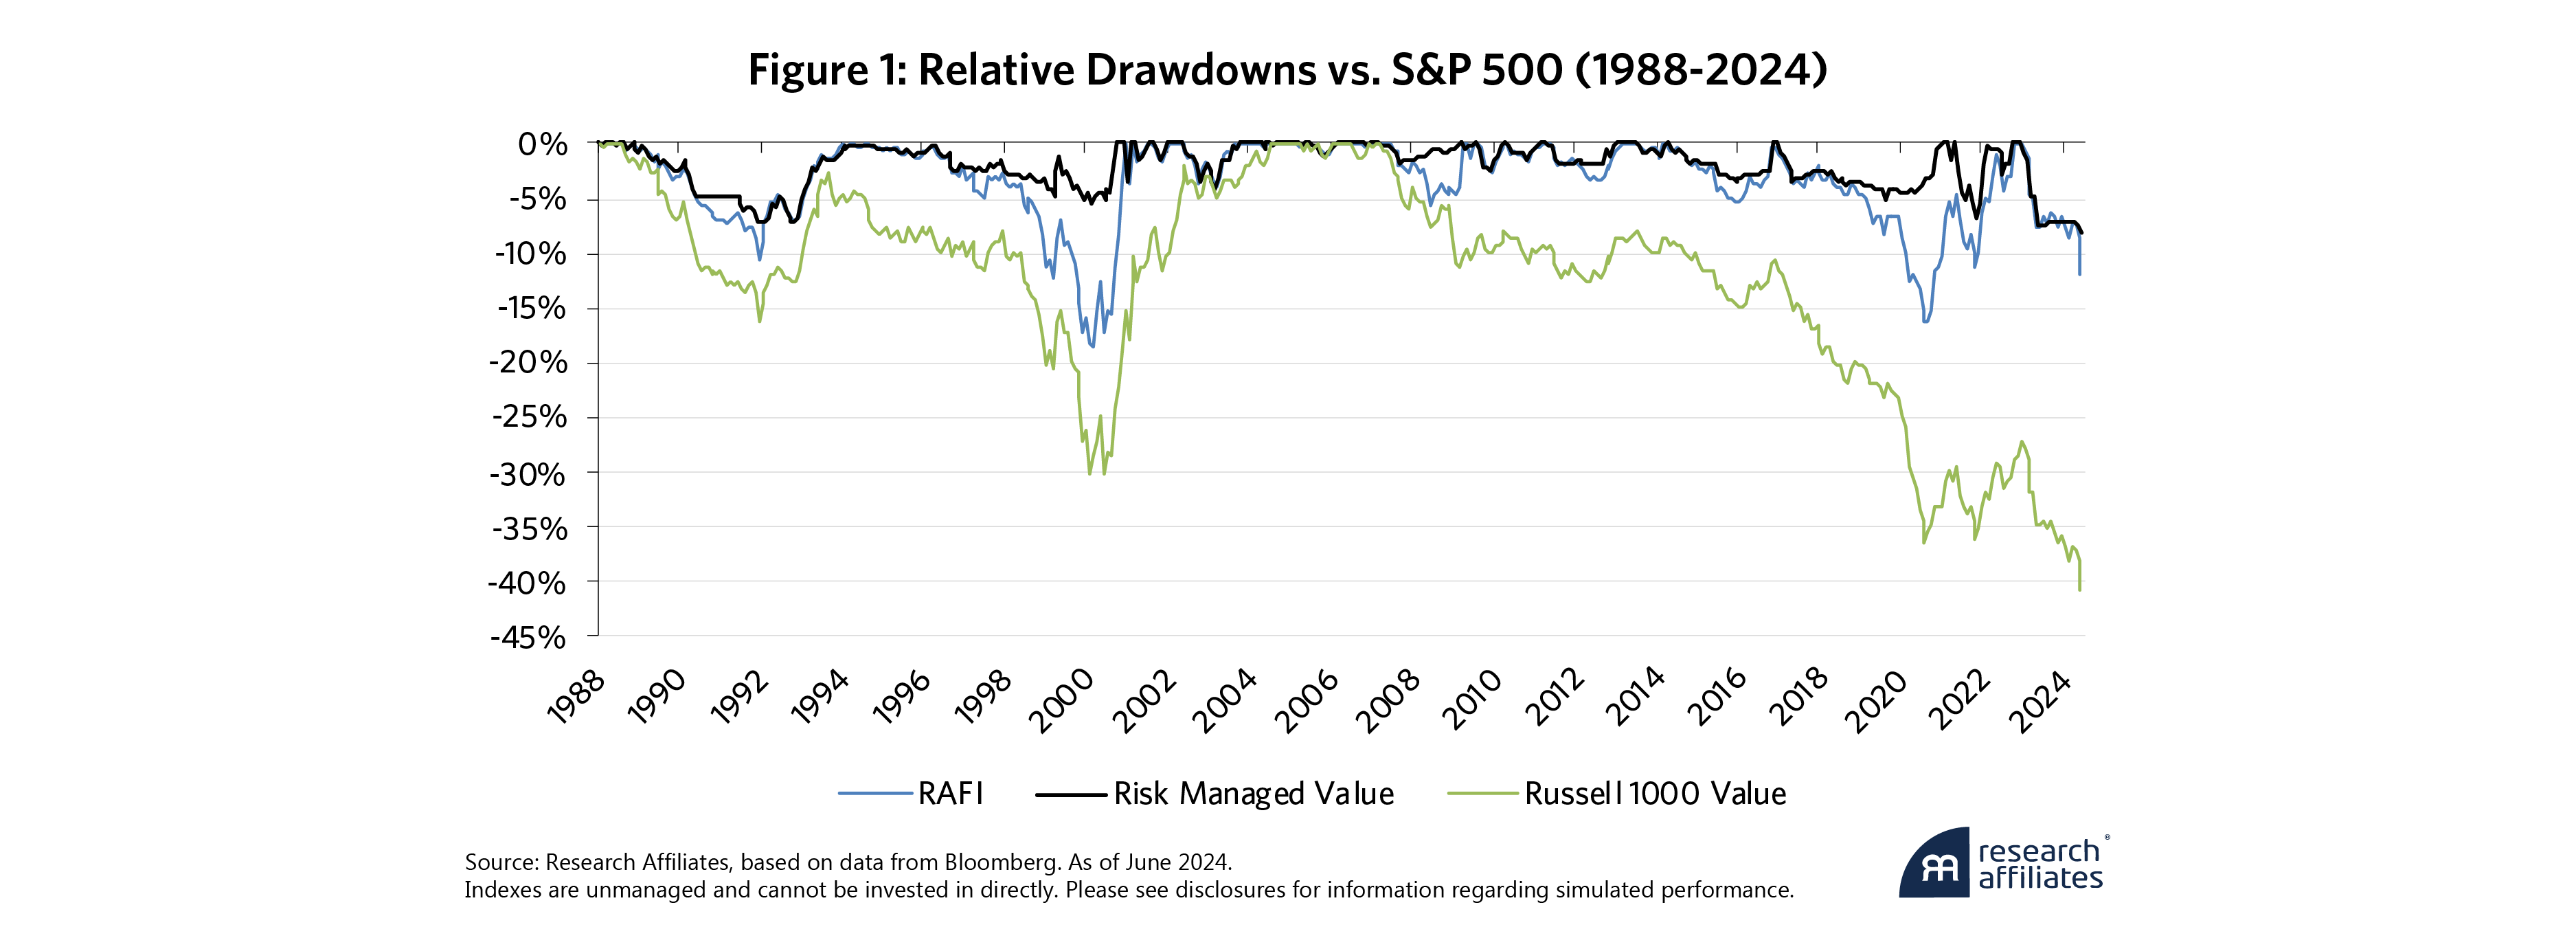
To examine the efficacy of RADTEC in managing the downside risk, Figure 1 shows the relative drawdowns (drawdown in relative wealth, i.e., peak-to-trough decline of a portfolio relative to a benchmark) of RAFI, RMV, and Russell 1000 Value relative to the S&P 500. The downside risk mitigation provided by RMV produces material improvements in relative drawdowns as measured in terms of magnitude and speed of recovery.
Risk Managed Growth
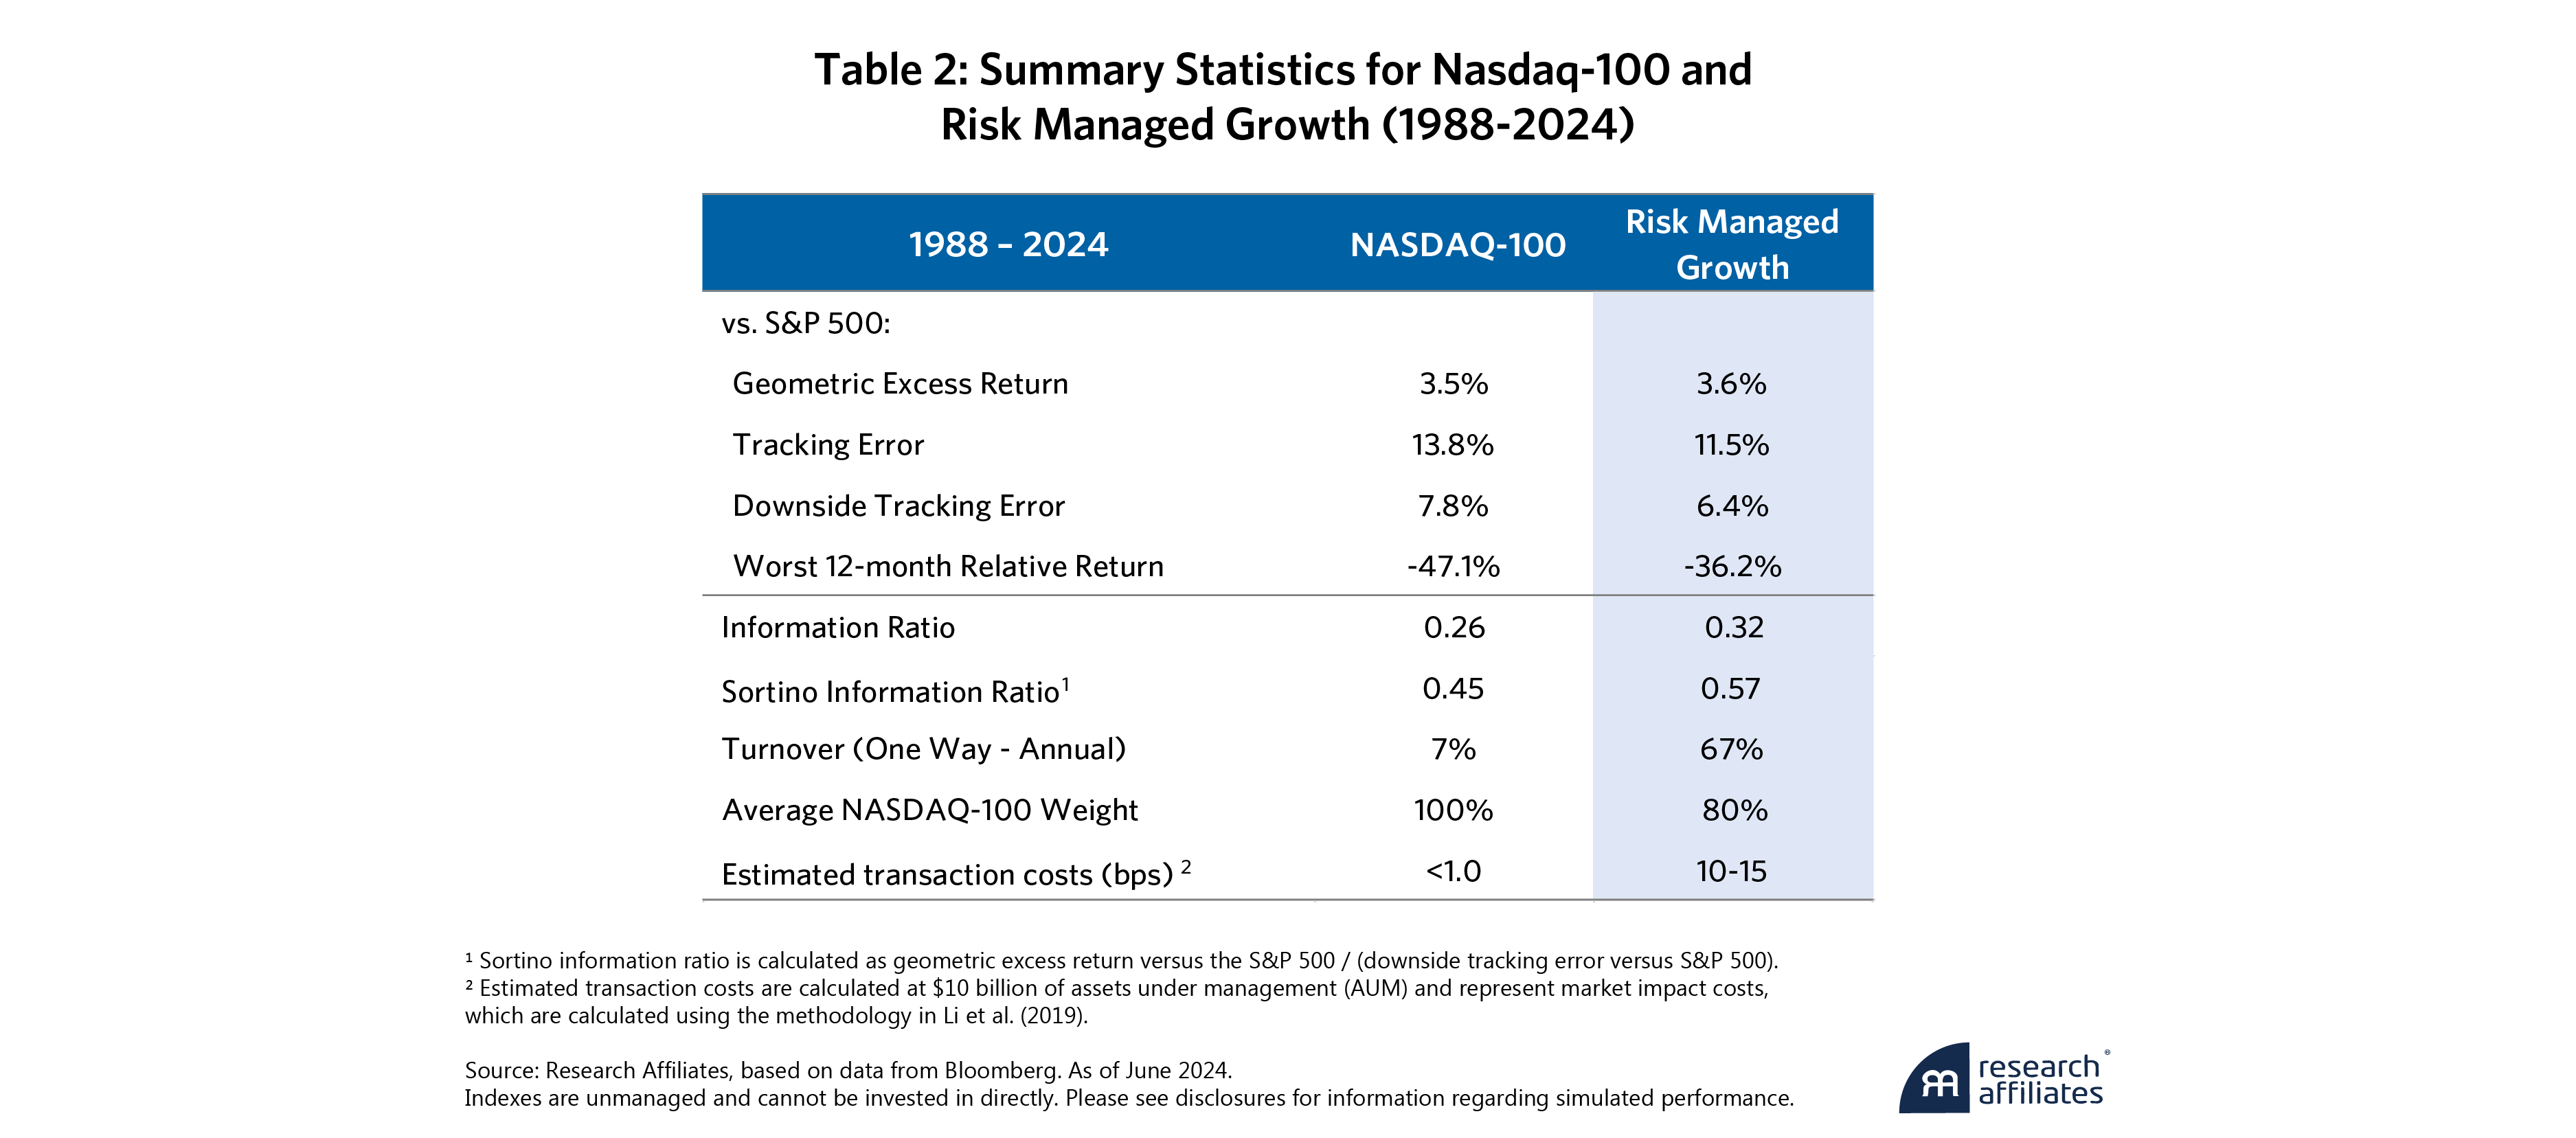
A second application of RADTEC is the Risk Managed Growth (RMG) strategy. In this strategy, RADTEC is used to dynamically blend the Nasdaq-100, a technology-heavy growth index, with the S&P 500. The goal is to provide exposure to the high-growth potential of technology companies while mitigating the downside risk associated with this volatile sector, particularly during market downturns. The S&P 500 serves as the benchmark portfolio.
Table 2 shows the simulated performance of RMG, which outperforms the Nasdaq-100 on a risk-adjusted basis, as evidenced by a higher Sortino information ratio. This improvement is achieved while also reducing tracking error and significantly mitigating the maximum drawdown compared with the Nasdaq-100. The risk management framework effectively reduces active risk when tracking error exceeds the predetermined target, as observed during the dot-com bubble collapse and the 2022 inflationary bear market.
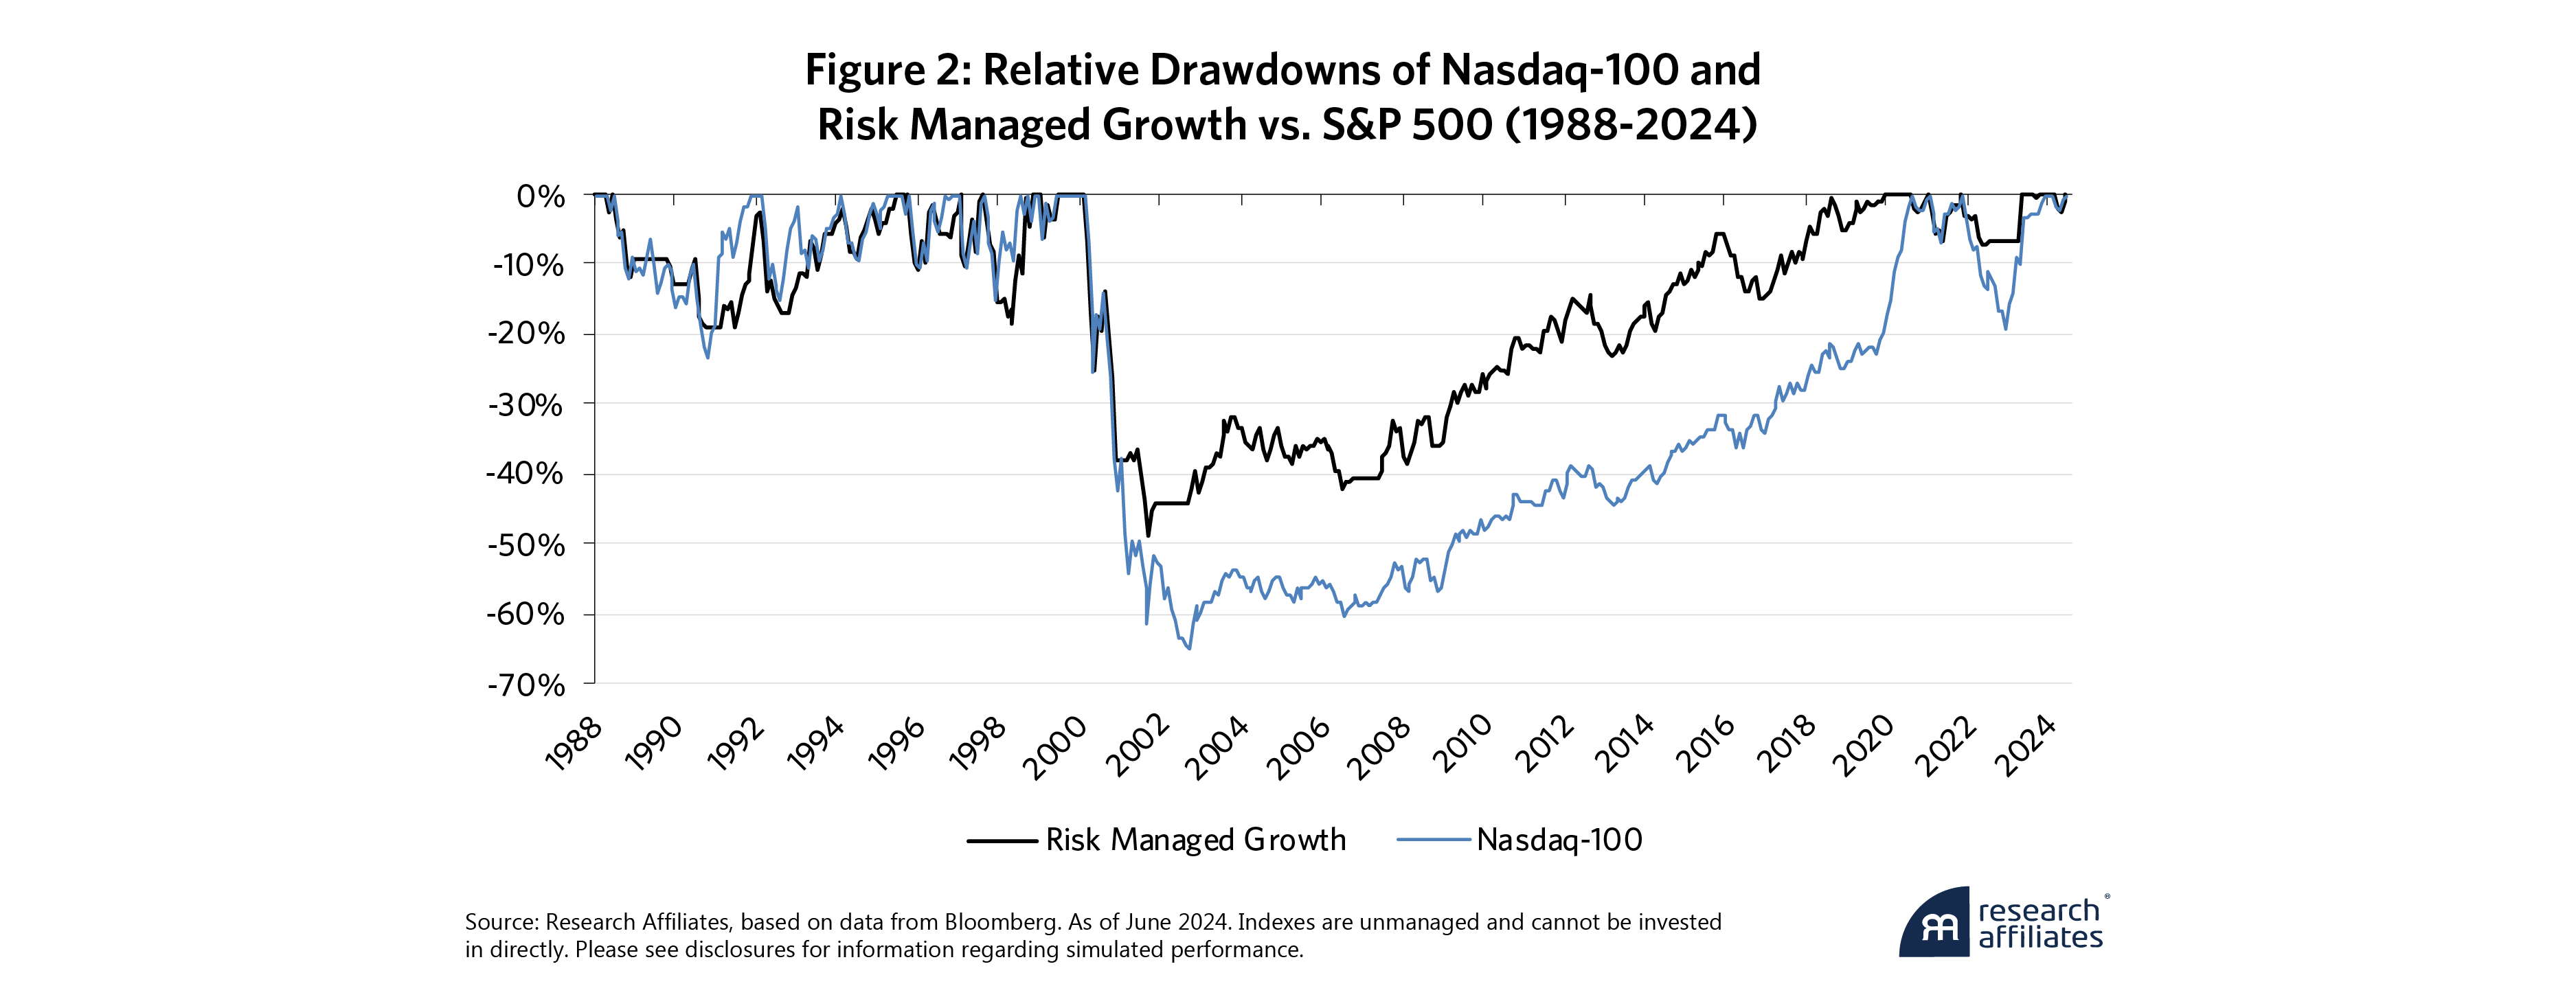
The effectiveness of RMG's risk management is further illustrated by its drawdown profile shown in Figure 2. While the Nasdaq-100 experienced a substantial relative drawdown during the dot-com bubble collapse and the 2022 inflationary bear market, RMG's drawdown profile was considerably improved in magnitude and speed of recovery. Although RADTEC does not eliminate the considerable risk in the highly volatile Nasdaq-100, this example demonstrates the ability of RADTEC to capture the upside performance while mitigating downside risk. This delivers a smoother investment experience for technology-oriented investors, potentially leading to improved long-term outcomes.
Value and Growth Opportunities
The Value and Growth Opportunities (VGO) strategy, a third application of RADTEC, dynamically allocates between the Research Affiliates Fundamental Index (RAFI) and the Nasdaq-100. VGO is designed to exploit the negative excess return correlation between value and growth styles, aiming to outperform both individually. This strategy uses RAFI as the active portfolio and the S&P 500 as the benchmark portfolio but pivots to the Nasdaq-100 (the proxy portfolio) if RAFI experiences downside tracking error to the S&P 500 and the risk target is breached.
VGO is suitable for investors who seek to capture the potential outperformance of both value and growth styles yet want to mitigate downside risk. By dynamically adjusting the allocation between RAFI and the Nasdaq-100, VGO aims to be on the right side of the value/growth trade, reducing downside tracking error relative to the S&P 500.
Table 3 shows that the simulated VGO strategy outperforms both RAFI and the Nasdaq-100 individually, achieving a higher average excess return than the average of the two. This outperformance is accompanied by a maximum drawdown that is significantly smaller than that of the Nasdaq-100 and comparable to that of RAFI. VGO's Sortino information ratio is more than double that of both RAFI and the Nasdaq-100, indicating superior risk-adjusted performance that is achieved through the dynamic timing of allocating to value and growth.
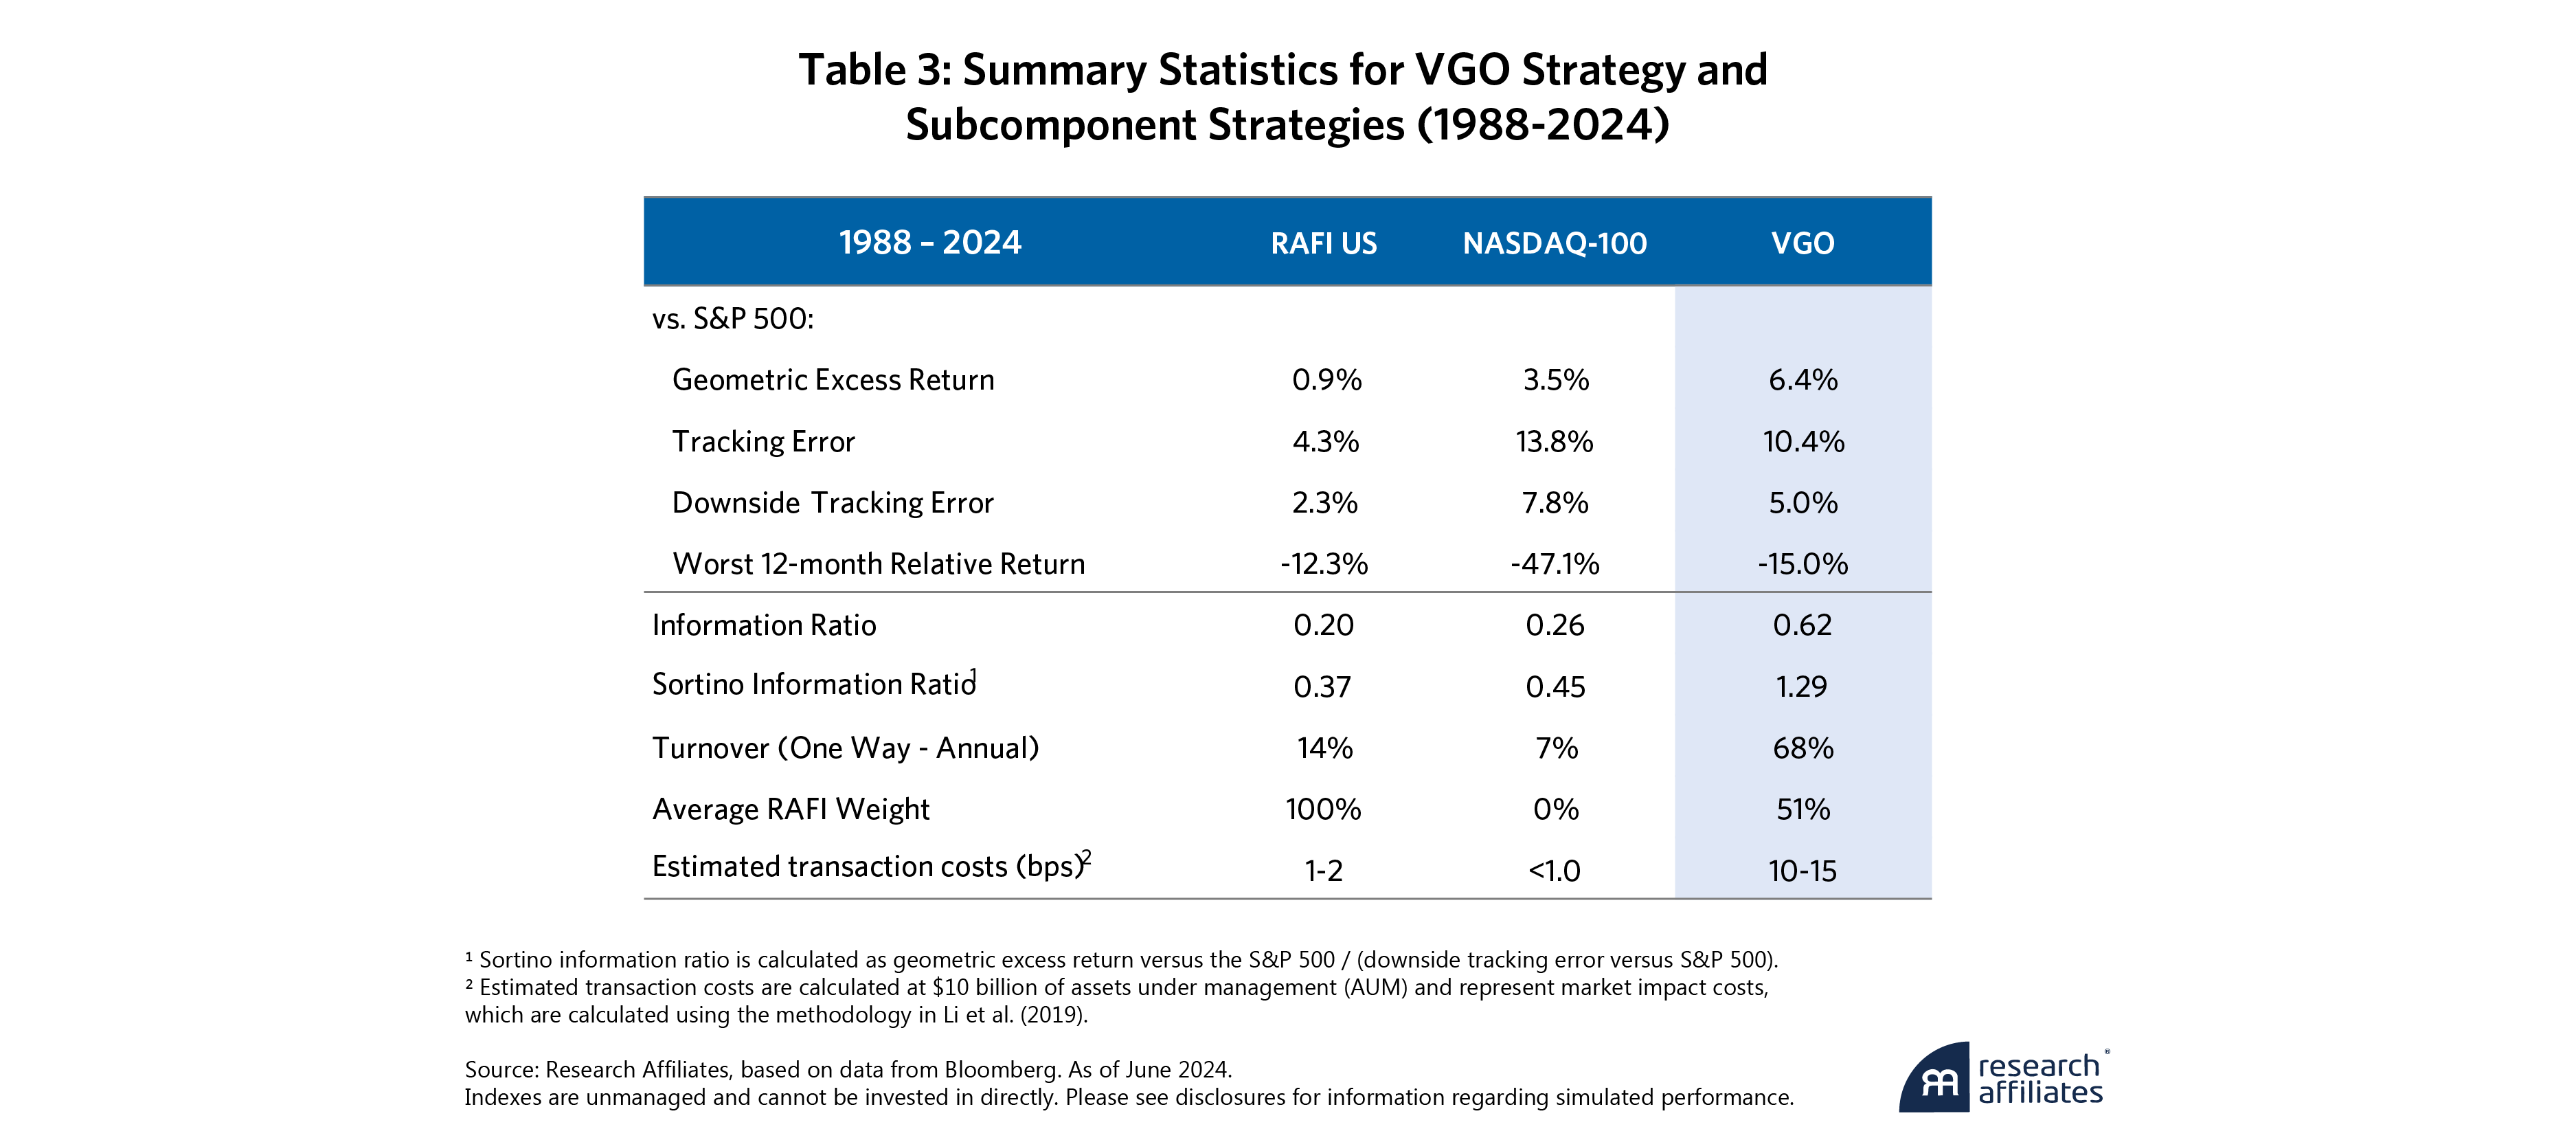
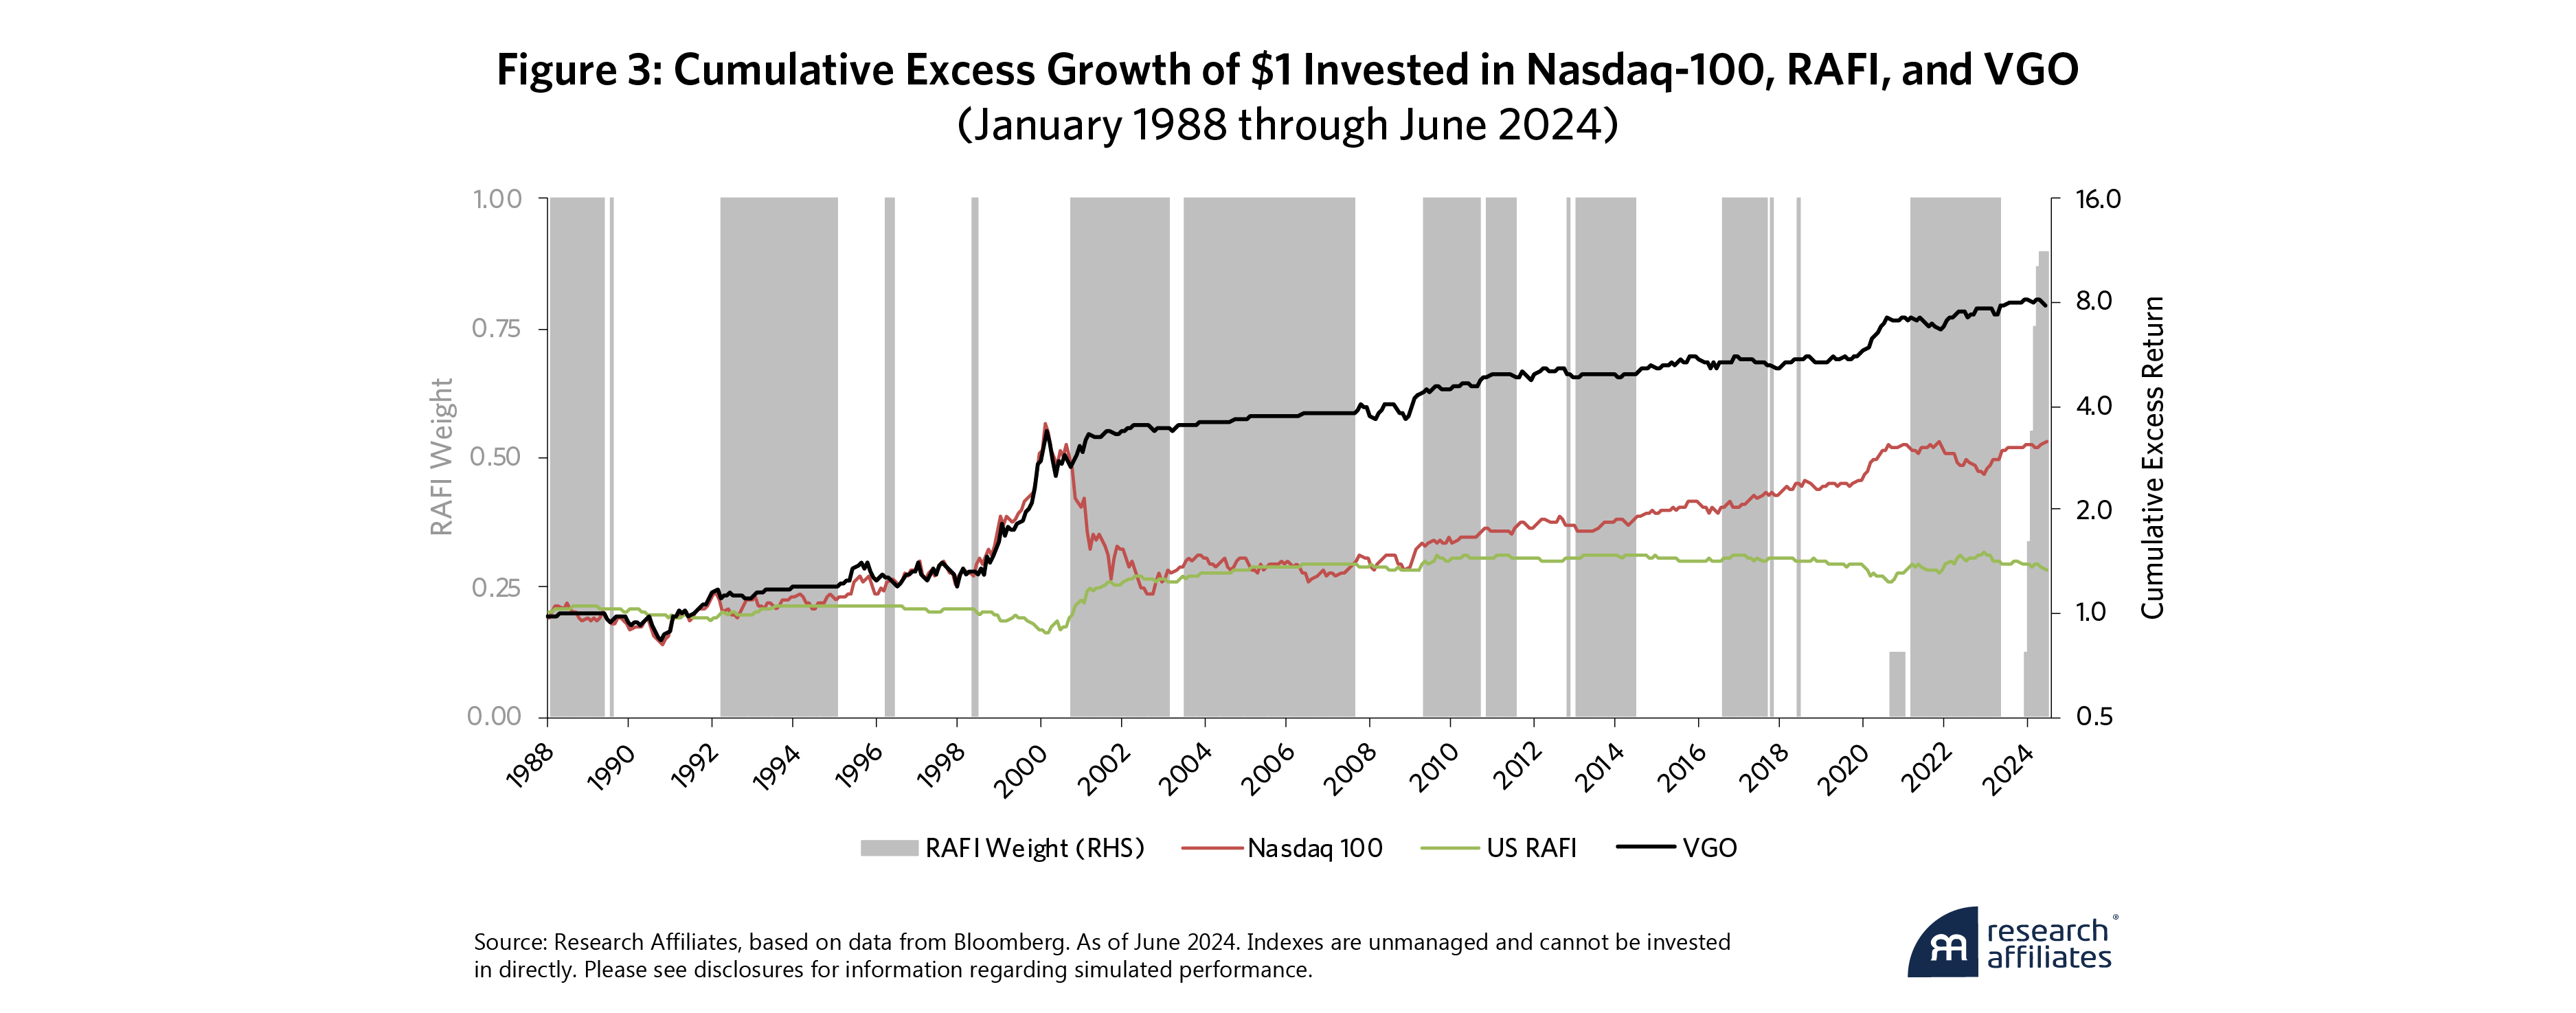
Figure 3 provides a time series illustration of how the VGO strategy achieves its superior returns. The chart overlays the cumulative excess return of both RAFI and the RMV strategy on shaded regions that indicate the magnitude of the active weight to RAFI as determined by RADTEC. VGO's dynamic allocation between value and growth styles allows it to adapt dynamically to changing market conditions and capture the potential outperformance of both styles while mitigating downside risk. This approach results in a higher tracking error than the RMV and RMG strategies, but it also offers the potential for higher returns.
Conclusion
RADTEC offers a dynamic risk management framework for active investment strategies. By adjusting the allocation between active and benchmark portfolios, RADTEC may reduce downside risk and improve risk-adjusted returns, thereby improving the investor experience. The framework's flexibility allows for application across various asset classes and investment styles, making it a potentially valuable tool for investors seeking to navigate the complexities of active management while mitigating downside risk.
Please read our disclosures concurrent with this publication: https://www.researchaffiliates.com/legal/disclosures#investment-adviser-disclosure-and-disclaimers.


References
Amenc, N., F. Goltz, A. Lodh, and L. Martellini, L. (2012). “Diversifying the Diversifiers and Tracking the Tracking Error: Outperforming Cap-Weighted Indices with Limited risk of Underperformance.” The Journal of Portfolio Management 38(3): 72-88.
Ang, A., J. Chen, and Y. Xing. (2006). “Downside Risk.” The Review of Financial Studies 19(4): 1191-1239.
Arnott, R., J. Hsu, and P. Moore. (2005). “Fundamental Indexation.” Financial Analysts Journal 61(2): 83-99.
Arnott, R., C. Brightman, X. Liu, and Q. Nguyen. (2023). “Reimagining Index Funds. Journal of Investment Management 21(4): 15-31.
Bollerslev, T., S. Z. Li, and B. Zhao. (2020). “Good Volatility, Bad Volatility, and the Cross Section of Stock Returns.” Journal of Financial and Quantitative Analysis 55(3): 751-781.
Farago, A., and R. Tédongap. (2018). “Downside Risks and the Cross-Section of Asset Returns.” Journal of Financial Economics 129(1): 69-86.
Harvey, C. R., and A. Siddique. (2000). “Conditional Skewness in Asset Pricing Tests.” The Journal of Finance 55(3): 1263-1295.
Harvey, C. R., J. C. Liechty, M. W. Liechty, and P. Müller. (2010). “Portfolio Selection with Higher Moments.” Quantitative Finance 10(5): 469-485.
Harvey, C. R., E. Hoyle, R. Korgaonkar, S. Rattray, M. Sargaison, and O. Van Hemert. (2018). “The Impact of Volatility Targeting.” Journal of Portfolio Management 45(1), 14-33.
Li, F., T. M. Chow, A. Pickard, and Y. Garg. (2019). “Transaction Costs of Factor-Investing Strategies.” Financial Analysts Journal 75(2): 62-78.
Moreira, A., and T. Muir. (2017). “Volatility-Managed Portfolios.” The Journal of Finance 72(4): 1611-1644.
Qiao, X., S. Yan, and B. Deng. (2020). “Downside Volatility-Managed Portfolios.” The Journal of Portfolio Management 46(7): 13-29.
