Elections and the Stock Market: Polarization Trumps Politics
An analysis of daily stock market performance before and after all 24 U.S. presidential elections since 1928 shows that the politics of the winner has less bearing on how the markets respond than how close and contentious the election was.
Stocks tend to fall in the run-up to a close election, then surge in the final week of the campaign before continuing their upswing, albeit with greater volatility, post-Election Day. We believe this is due to fear of the outcome increasing (on both sides of the aisle) ahead of the election and then dissipating (on one side of the aisle).
In the lead-up to an election, growth and value stocks tend to exhibit similar performance. After the election, however, value stocks tend to rebound when Republicans win the White House, while growth stocks tend to rebound when Democrats take office.
Introduction
“Elections have consequences,” President Barack Obama famously told congressional Republicans after his 2012 reelection. That they do, and for financial markets, their consequences are most pronounced when the outcome is close and the body politic polarized.
Create your free account or log in to keep reading.
Register or Log in
Indeed, how an election affects the markets is only mildly a function of what policies the winner favors, whether they are Republican or Democrat, whether they embrace the free market or a more regulated economy, or whether they prefer an interventionist foreign policy over an isolationist one. An election’s short term market impact depends more on just how close and contentious it is. Of course, every presidential election is declared to be the most important of all time, exposing us to a litany of horrors if the other side wins. So, for our purposes, close and contentious means too-close-to-call, because all such elections feel contentious in the run up to election day.
In slim-margin, divisive races, the stock market often rebounds in the week before voters head to the polls, perhaps because expectations are set and the outcome seems less in doubt as the election approaches. Stocks may also swing higher in the days after the ballots are cast and the contest decided, regardless of the winner’s politics.
In slim-margin, divisive races, the stock market often rebounds in the week before voters head to the polls, perhaps because expectations are set and the outcome seems less in doubt as the election approaches. Stocks may also swing higher in the days after the ballots are cast and the contest decided, regardless of the winner’s politics.
”Why would liberal versus conservative matter less than whether the election is tight and the electorate polarized? Because if each side views losing as a disaster, their partisans will invest accordingly. They will be risk-off in the run-up to the election. But once the election is over and the uncertainty dissipates, those on the winning side will be relieved by the outcome and return to risk-on positions. Those on the losing side will no doubt be despondent, but they are already risk-off, so their portfolios already reflect those fears. Both sides sell in the weeks before the election. One side buys in its aftermath.
We tested this thesis in a superficial way back in the 2000s and applied it in futures overlays for a few too-close-to-call U.S. and non-U.S. elections. A billionaire client of ours was a major Democratic donor who was so panicked that President George W. Bush might secure a second term during the 2004 election campaign that he wanted to liquidate his stock holdings just in case Bush won. We explained that people on both sides of the political divide had similar inclinations and would go risk-off lest their side loses. After the election, the half of the electorate that welcomed the outcome would go risk-on. We encouraged him to defer his decision at least until a few weeks after the polls closed. He followed our advice, and the market rose 7% in the first 30 trading days after his dreaded Bush victory. By then, to his considerable benefit, our client had decided not to sell at all!1
Why would liberal versus conservative matter less than whether the election is tight and the electorate polarized? Because if each side views losing as a disaster, their partisans will invest accordingly. They will be risk-off in the run-up to the election.
”To more thoroughly and systematically test this thesis, we examined the behavior of three popular factors (market, size, and value as defined by the Fama-French three factor model) in the 30 trading days before and after all 24 U.S. presidential elections since 1928.2
Close Elections vs. Landslides
While passions might have run high in all these contests, not all of them were close. Often the winners had wide enough support to secure resounding victories that were widely expected far in advance of the election. To determine which elections qualified as close, we developed an election uncertainty metric based on the state-by-state difference in popular vote. If the electoral votes of all the states the winner carried by less than 4% add up to more than the winner’s margin of victory in the Electoral College, our metric identifies that election as close.
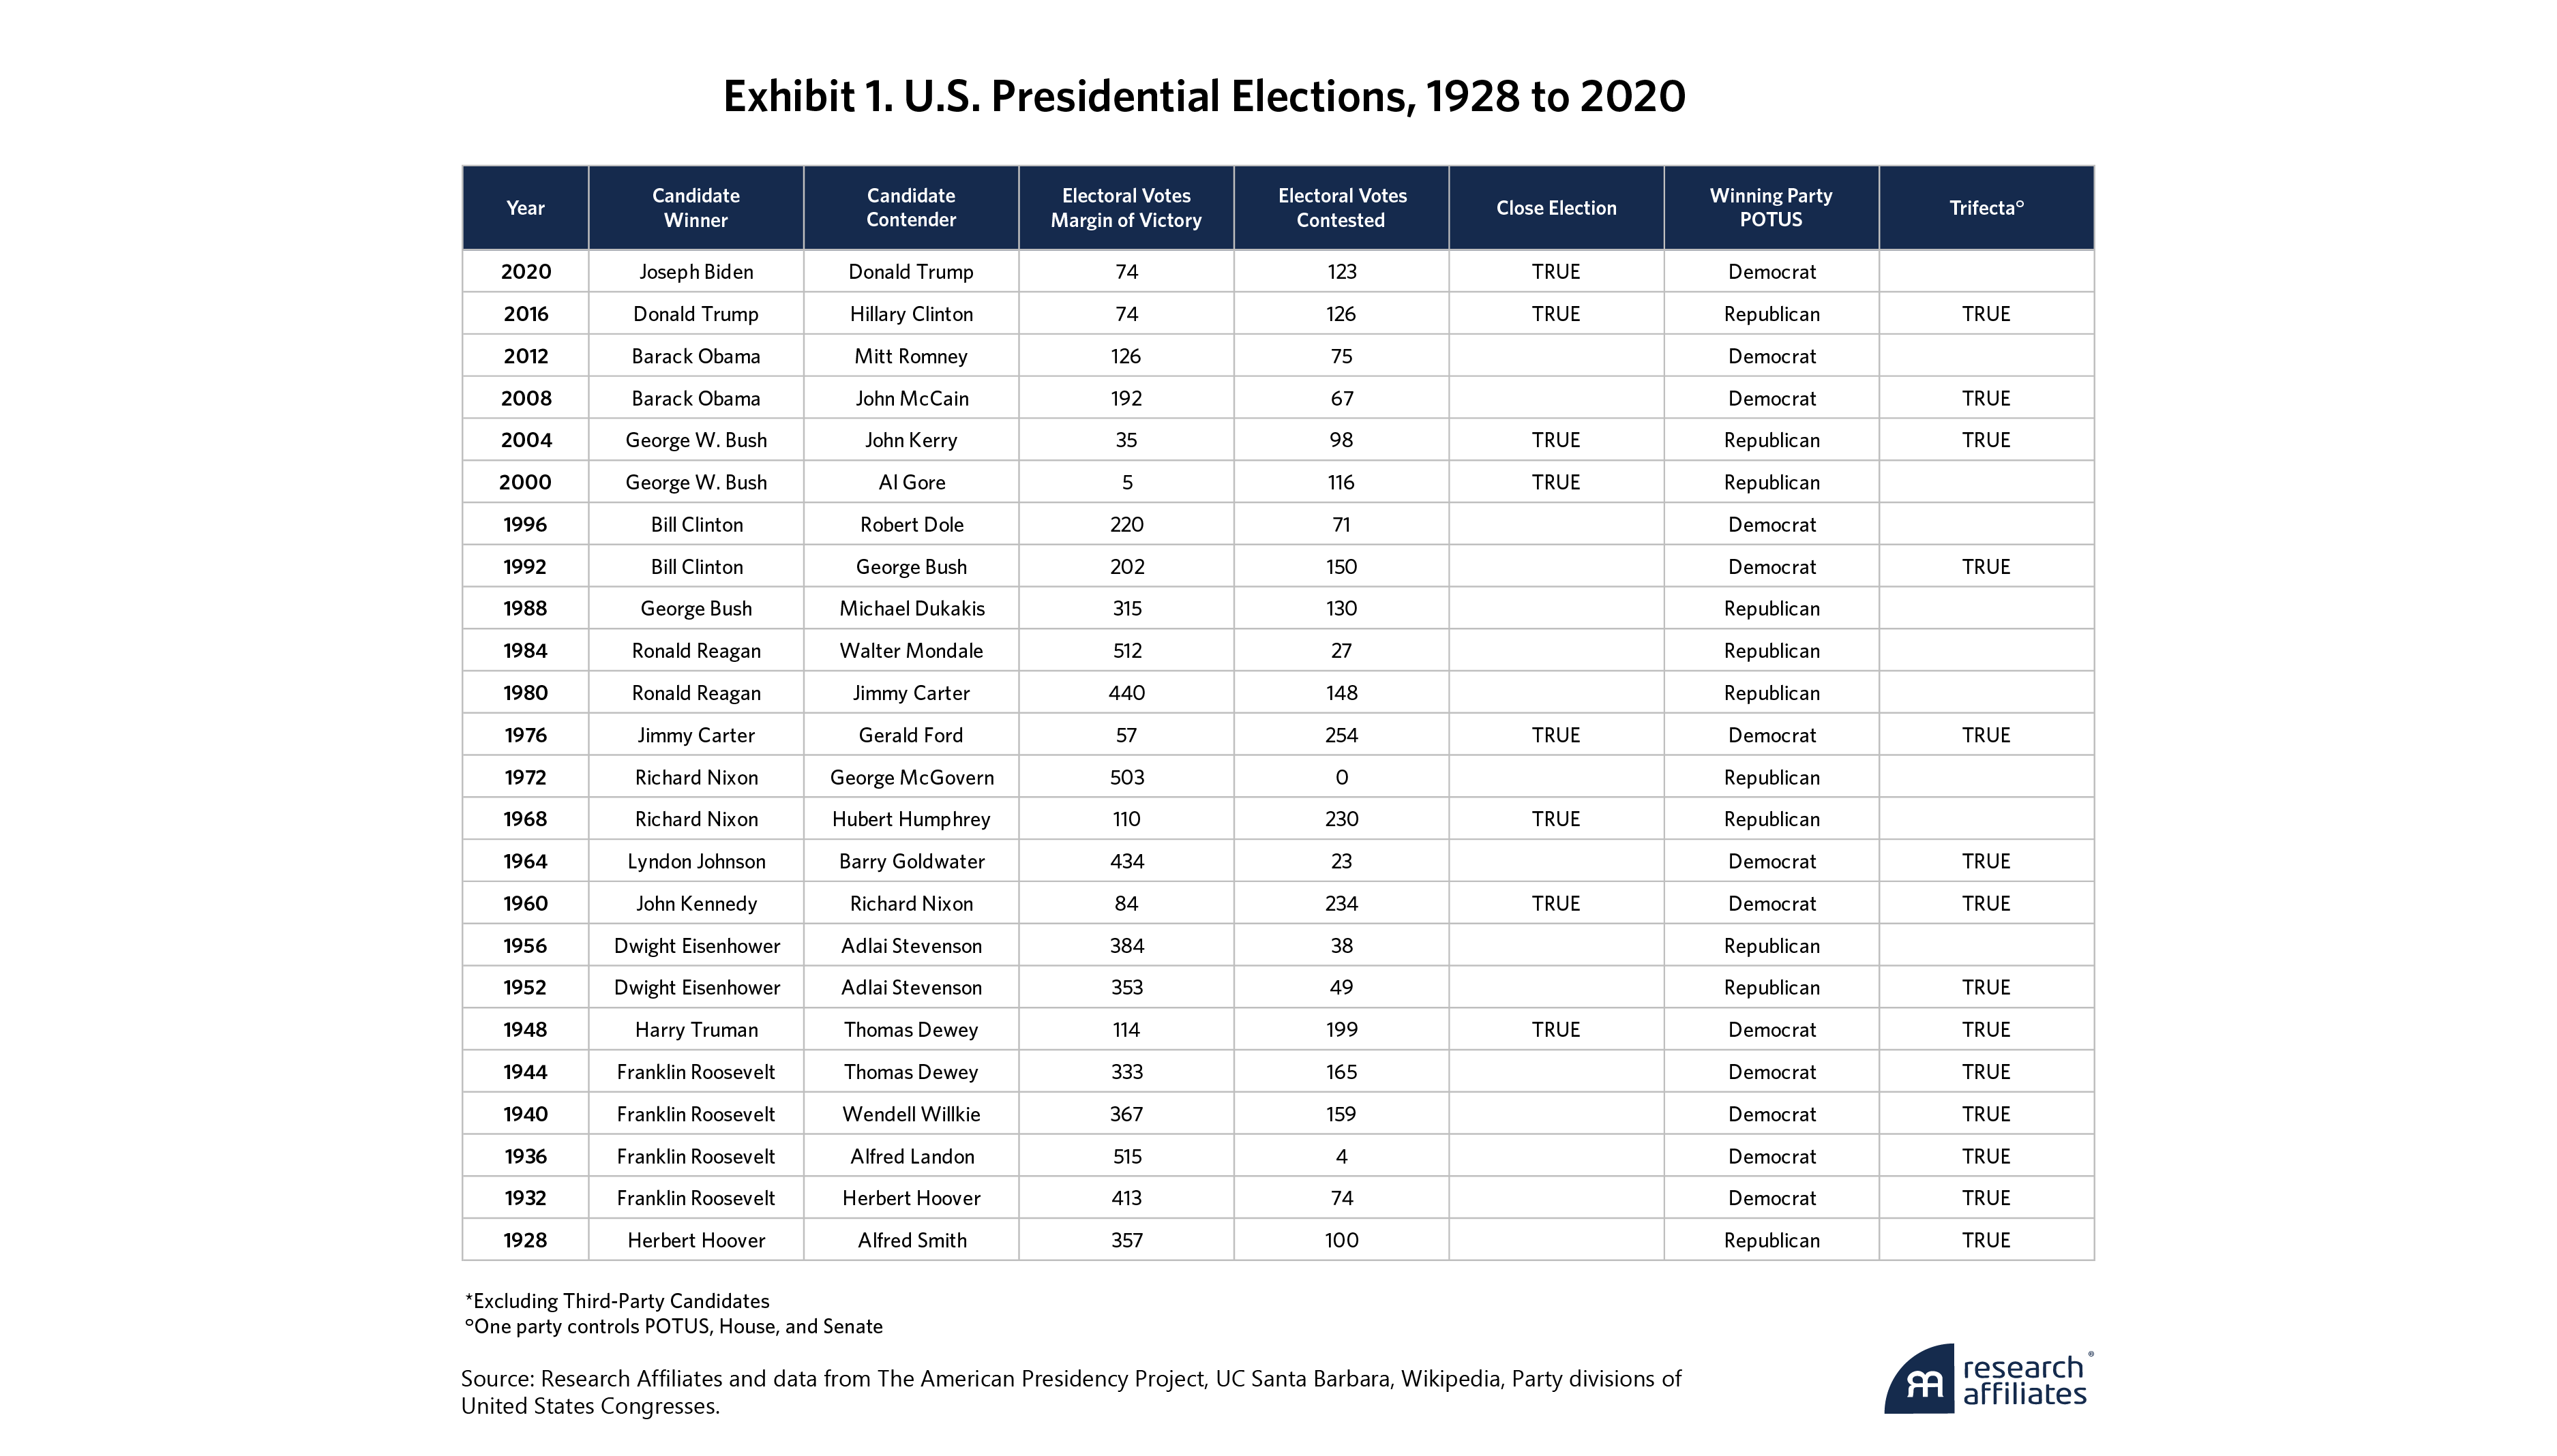
Exhibit 1 shows the eight elections out of twenty-four that meet this criterion. Those are Harry Truman vs. Thomas Dewey in 1948, John F. Kennedy vs. Richard Nixon in 1960, Nixon vs. Hubert Humphrey in 1968, Jimmy Carter vs. Gerald Ford in 1976, George W. Bush vs. Al Gore in 2000, Bush vs. John Kerry in 2004, Donald Trump vs. Hillary Clinton in 2016, and Joe Biden vs. Trump in 2020. At one extreme, Bush beat Gore by 5 electoral votes in 2000, with the closely contested states combining for 116 total electoral votes. The outcome was a cliffhanger, to say the least.3 At the opposite extreme, in 1972, Nixon beat George McGovern by 503 electoral votes and no state was close. The outcome was a foregone conclusion almost from the outset. And the market was bored.4
Prior Research on Politics and Stock Returns
Departing from our analysis of daily returns, past research has focused on multi-year market returns conditional on the party in power. It demonstrates that U.S. stocks have performed better under Democratic administrations. Lubos Pastor and Pietro Veronesi (2017) show that between 1925 and 2015, stocks rose 10.7% per year on average when Democrats held the White House and fell 0.2% per year under Republicans.5 But as we pointed out in 2017, the Pastor and Veronesi results are skewed by the Great Depression, from 1929 to 1932, and the Global Financial Crisis (GFC) in 2008. Exclude those periods and there is little difference between markets under Republican and Democratic presidents.6
But what about Australia, Canada, France, Germany, and the UK? Did their stock markets perform better under left- or right-of-center governments? Our out-of-sample test did not indicate any relationship between which party won an election and how the stock market fared during its time in power. Victories by conservative parties in Australia, Germany, and the UK and by liberal parties in Canada and France seemed to bode well for each country’s equity market, but none of the five showed any statistical significance.
… Republican and Democratic victories lead to near-identical outcomes in the 30 trading days after an election.
”Political discussions can sometimes elicit strong emotional responses. Some readers may dismiss analyses that fail to confirm their priors, especially when the underlying methodology is easy to criticize. Several political science academics excoriated us in emails and letters, not for any flaws in our methodology, but for failing to confirm the popular but misleading U.S. finding. We stand by our 2017 results. Markets can do well or badly, whatever party is in power. Our latest U.S. presidential election analysis reiterates this point.
Stock Market Behavior Pre- and Post-Election
In Exhibit 2, Panel A, we begin by analyzing market performance in the 30 trading days before and after all the U.S. presidential elections in our sample. The gray band represents the 95% confidence interval, which is a full sample four standard deviation range centered on our null hypothesis of zero excess return.7
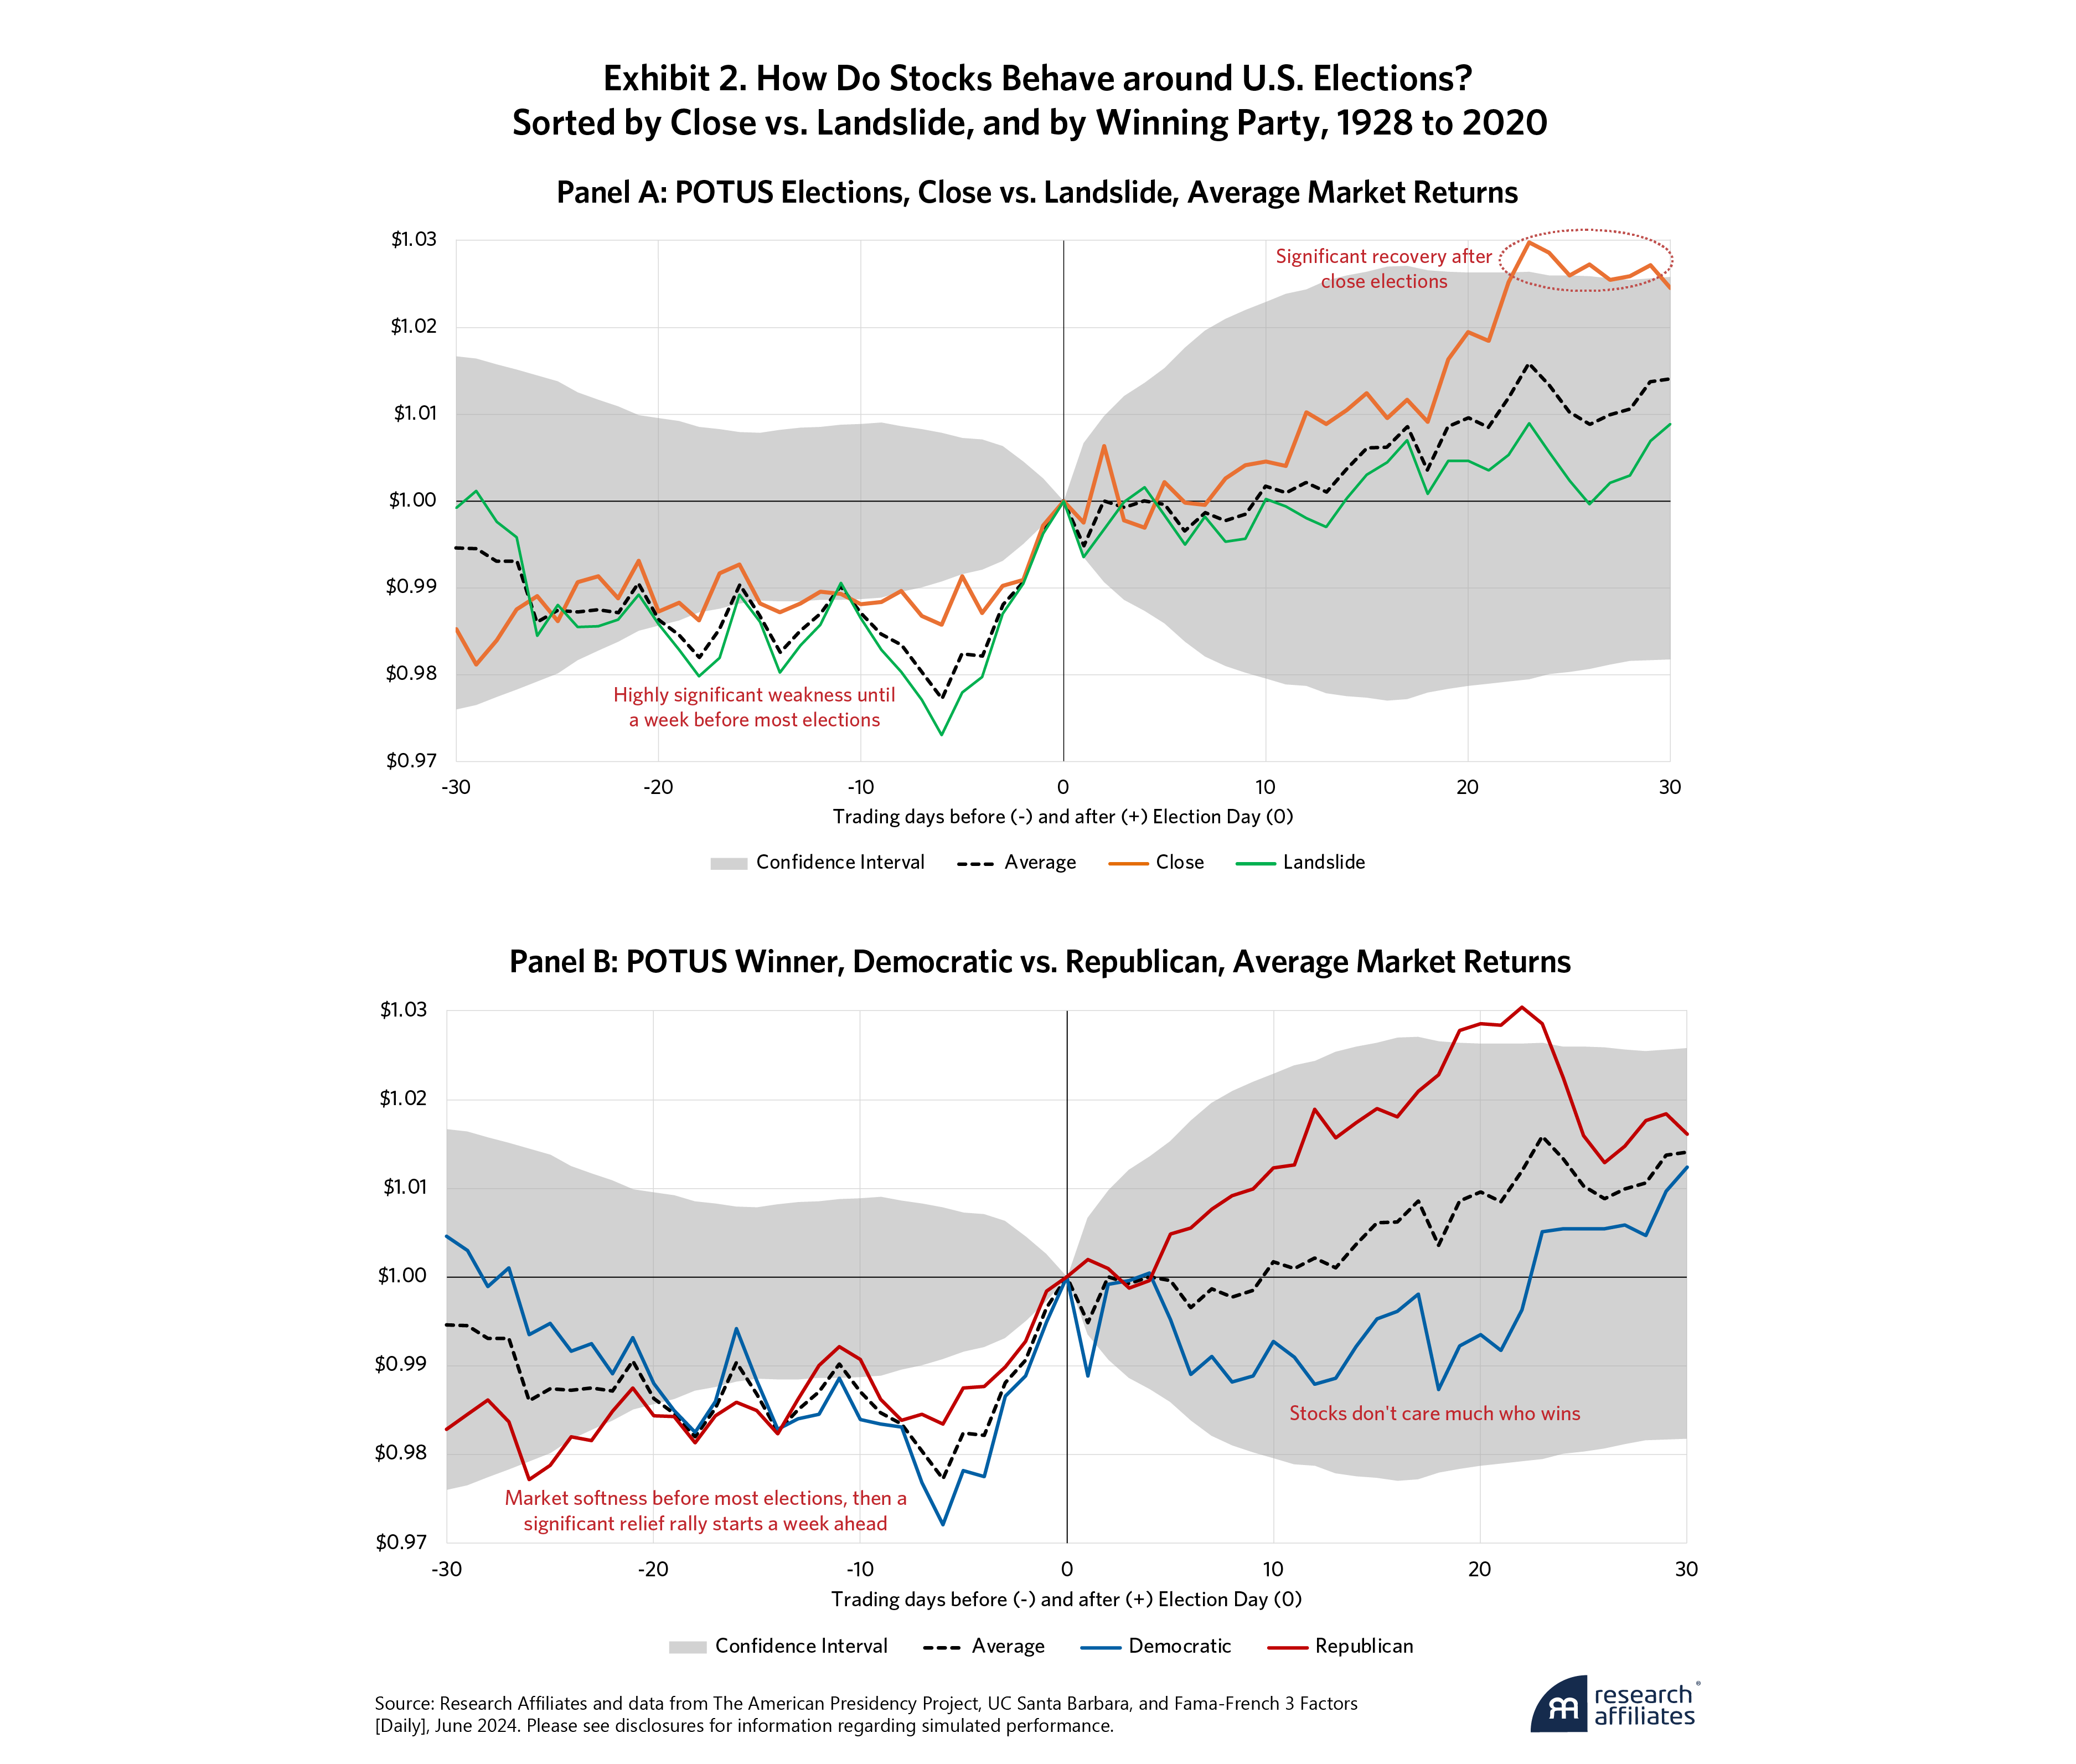
The average outcome, displayed as the black dashed line, shows that the stock market tends to fall in the weeks heading into the vote but spikes in the campaign’s final week. This weakness is well outside our 95% confidence interval and seems fairly robust.8 We believe that the election result likely becomes clearer and less alarming to voters in the final stretch of the campaign, causing the market to snap back. Then, the post-election period is usually pretty dull, except after close elections, when the stock market rallies about 2.5% over the next 30 trading days. Again, this is outside the confidence interval, so the pattern seems to have merit.
Exhibit 2, Panel B, shows the simple averages for Democratic and Republican presidential wins. In contrast to the divergence between close elections and uncompetitive races, Republican and Democratic victories lead to near-identical outcomes in the 30 trading days after an election. Along the way, there seems to be a 3% market rally 19-23 trading days after a Republican win outside of the confidence interval. Given the short, unstained nature of the rally, we are skeptical that it has merit.
While not visualized here, the markets have delivered outsized gains when Republicans hit the trifecta, winning the presidency and control of the House and Senate. However, this has only happened four times since 1928, so the sample size is too small to be statistically significant.9
[G]rowth and value show similar performance except in close elections, when value has historically outperformed growth stocks before and after the election.
”Shifting the focus away from market returns, our analyses of the Fama-French size and value factors reveal some intriguing takeaways.10 Exhibit 3, Panel A, shows that small caps tend to struggle compared to large caps heading into Election Day and weakly rebound afterward. It's a different story in the event of a close election. Before the election, there's no discernible difference in small cap versus large cap returns. Following a close election, small cap stocks have historically outperformed large cap stocks by about 2.5% over the next 30 trading days, similar to the magnitude of the market rally. This looks like another manifestation of the risk-off, risk-on pattern. Both sides fear losing and take risk off the table as the election approaches. After the election, the winning side is emboldened and buys back into the market and into small caps. Since investors tend to view small caps as more risky than large caps, this aligns with our thesis. Again, the confidence interval indicates this is a robust phenomenon.
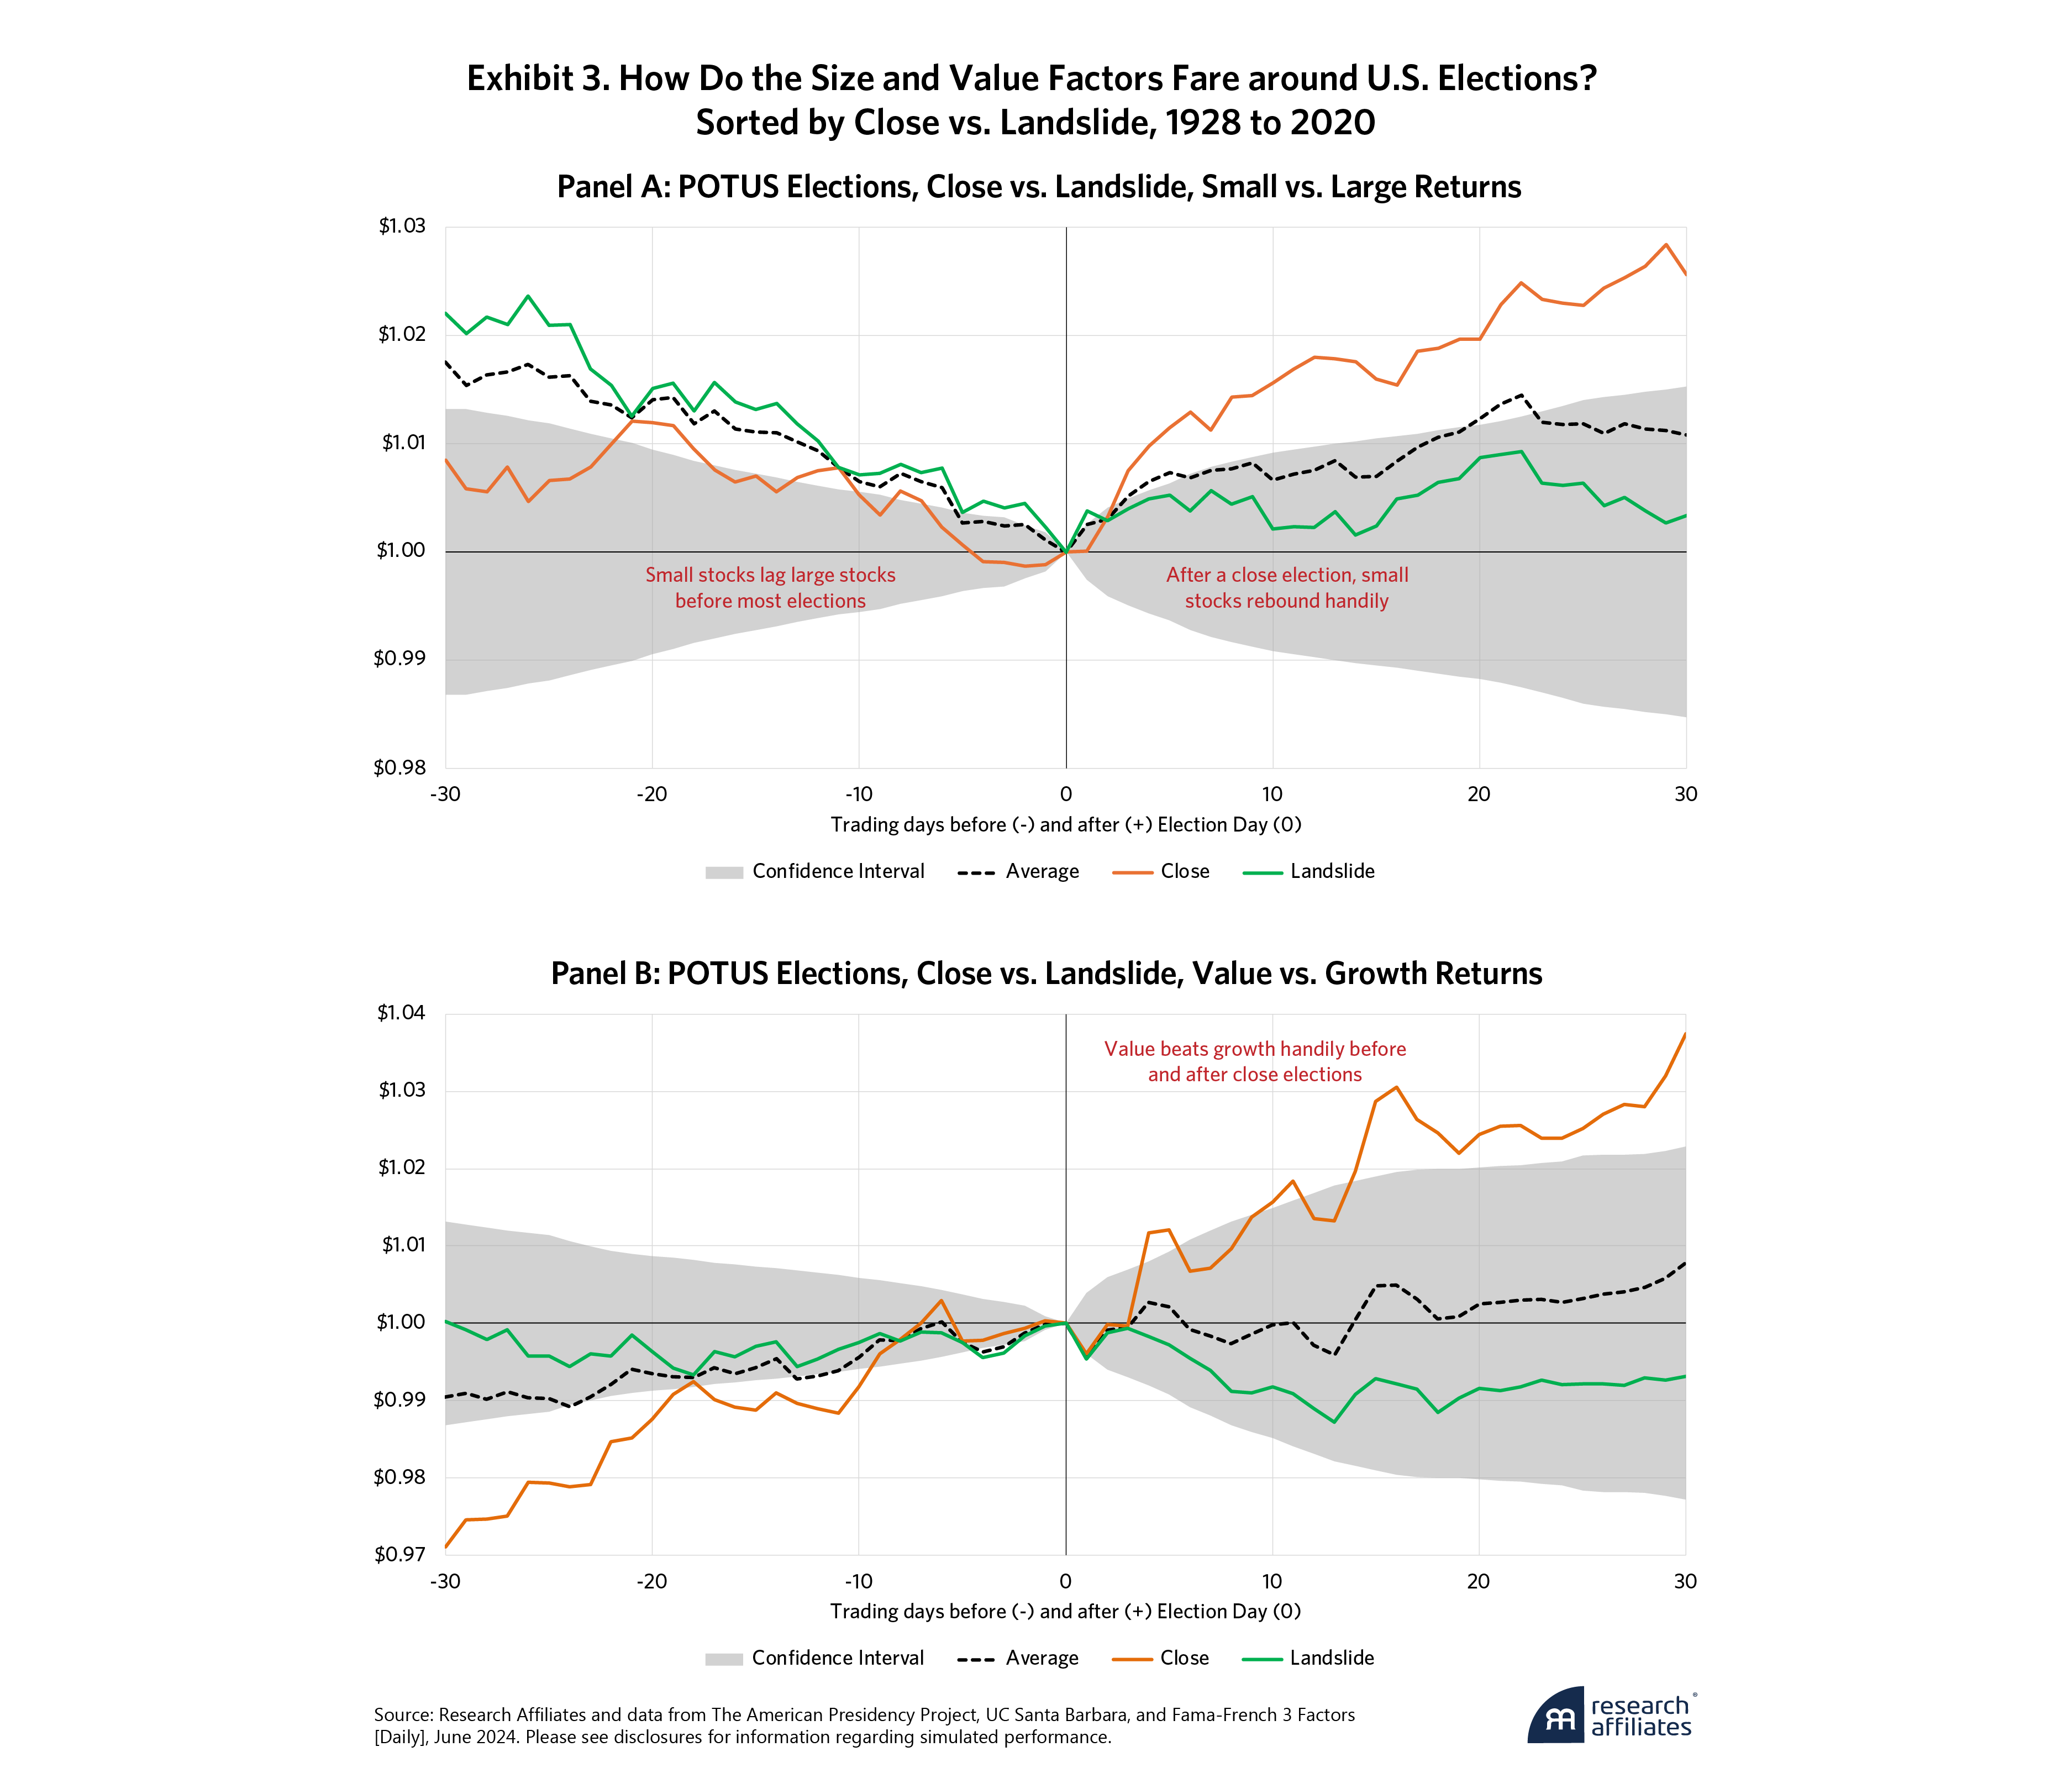
In Exhibit 3, Panel B, growth and value show similar performance except in close elections, when value has historically outperformed growth stocks before and after the election. These returns go well beyond the 95% confidence interval, with a cumulative gain of about 6% in just 13 weeks.11 In landslide elections, this pattern weakens to the point of statistical irrelevance. We did not have any particular Bayesian prior hypothesis for this test, but the size of the gain is pretty compelling. Assuming the upcoming election will be close, history suggests we should tilt toward value. So, maybe we should avoid owning the Magnificent Seven during this period in 2024?
Next, we repeat Exhibit 3, except through the traditional lens of the winning political party. Exhibit 4, Panel A, demonstrates again that small caps have historically struggled relative to large caps before Election Day. Post-Election Day, small caps historically rebound by about 0.50% over four days, regardless of the winning party. Thereafter, small cap performance is statistically insignificant following a Republican win, while a 2% outperformance relative to has historically been displayed after a Democrat win.
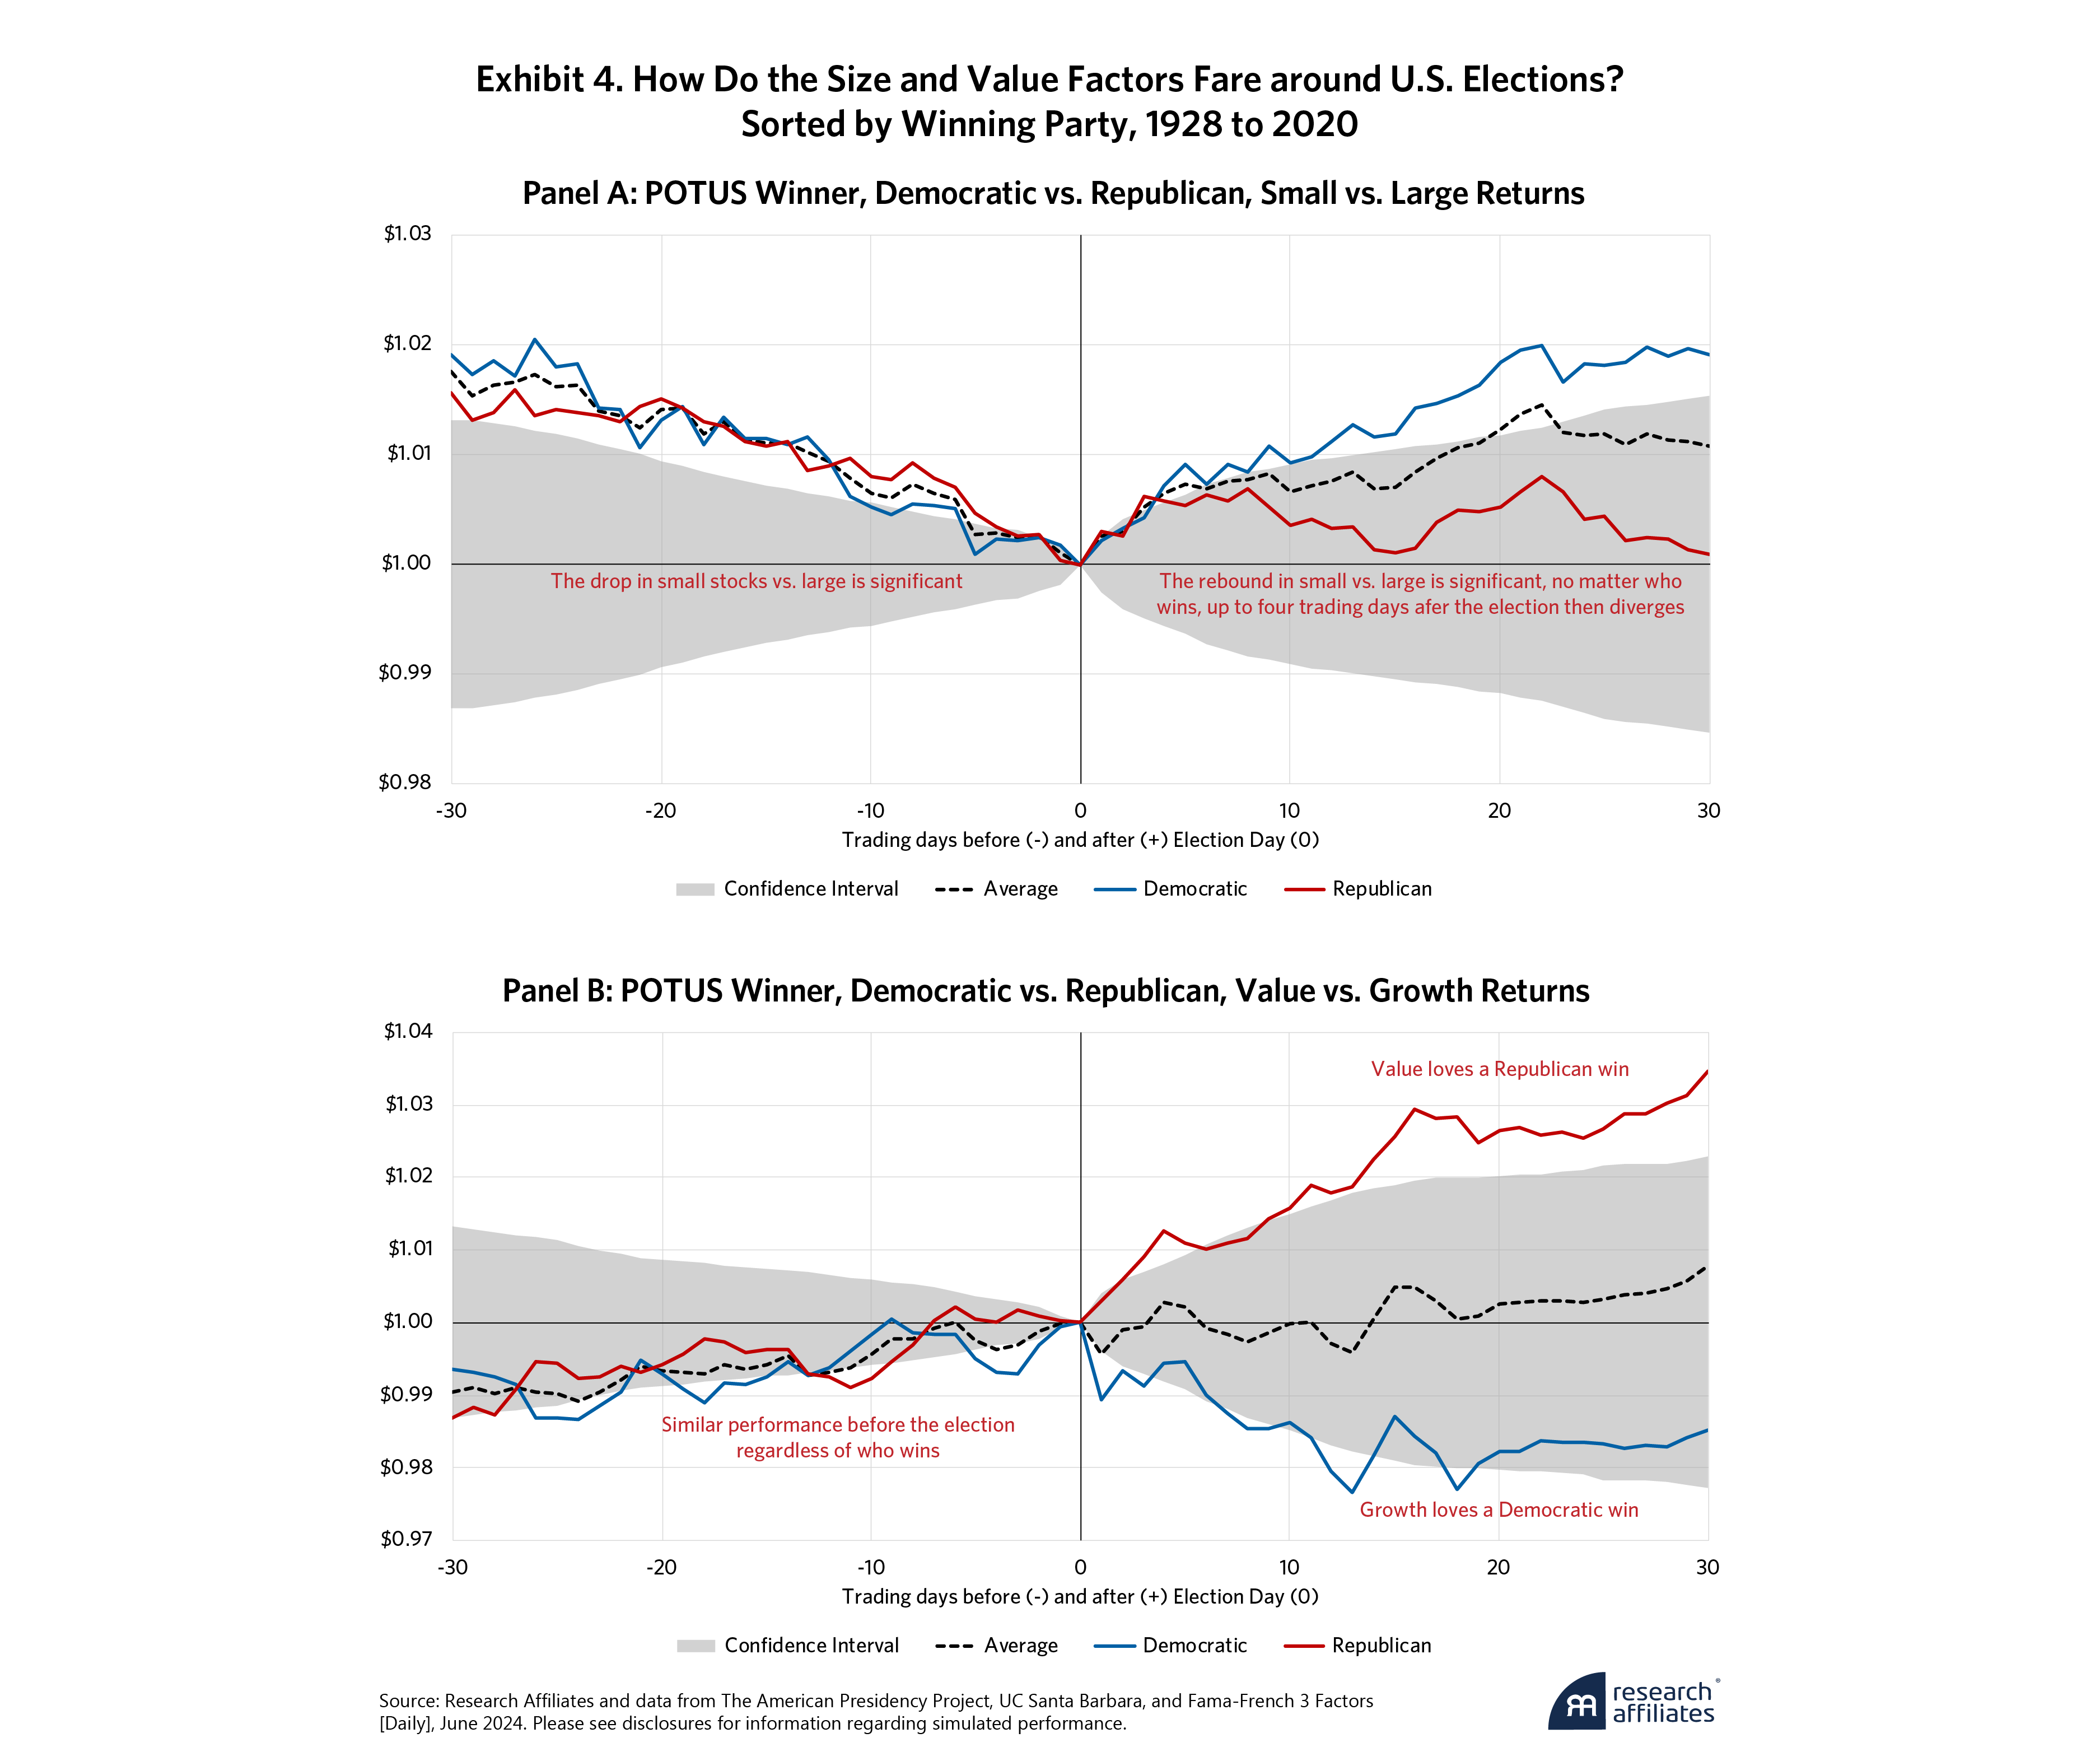
The growth and value comparison yields perhaps our most noteworthy result. Since we use Fama-French definitions, value stocks are “cheap” based on their price-to-book value ratio and growth stocks are chosen for their high price-to-book valuation multiples rather than their growth rates.12 The winning party makes a considerable difference for the value factor, as Exhibit 4, Panel B, indicates. In the lead-up to an election, value and growth show similar performance, regardless of the outcome. After the election, value stocks tend to rebound over 3% when Republicans win the White House, while growth stocks tend to rebound nearly 2% when Democrats take office.
Finally, market volatility (and factor returns) tends to spike for several days following an election. The confidence intervals—which result from the dispersion of returns—are wider post-election, which means that volatility is more pronounced after the votes are cast and the winner declared (see the increased width of the preceding exhibits’ gray band post-election). This should surprise no one since half of the electorate moves from risk-off to risk-on.
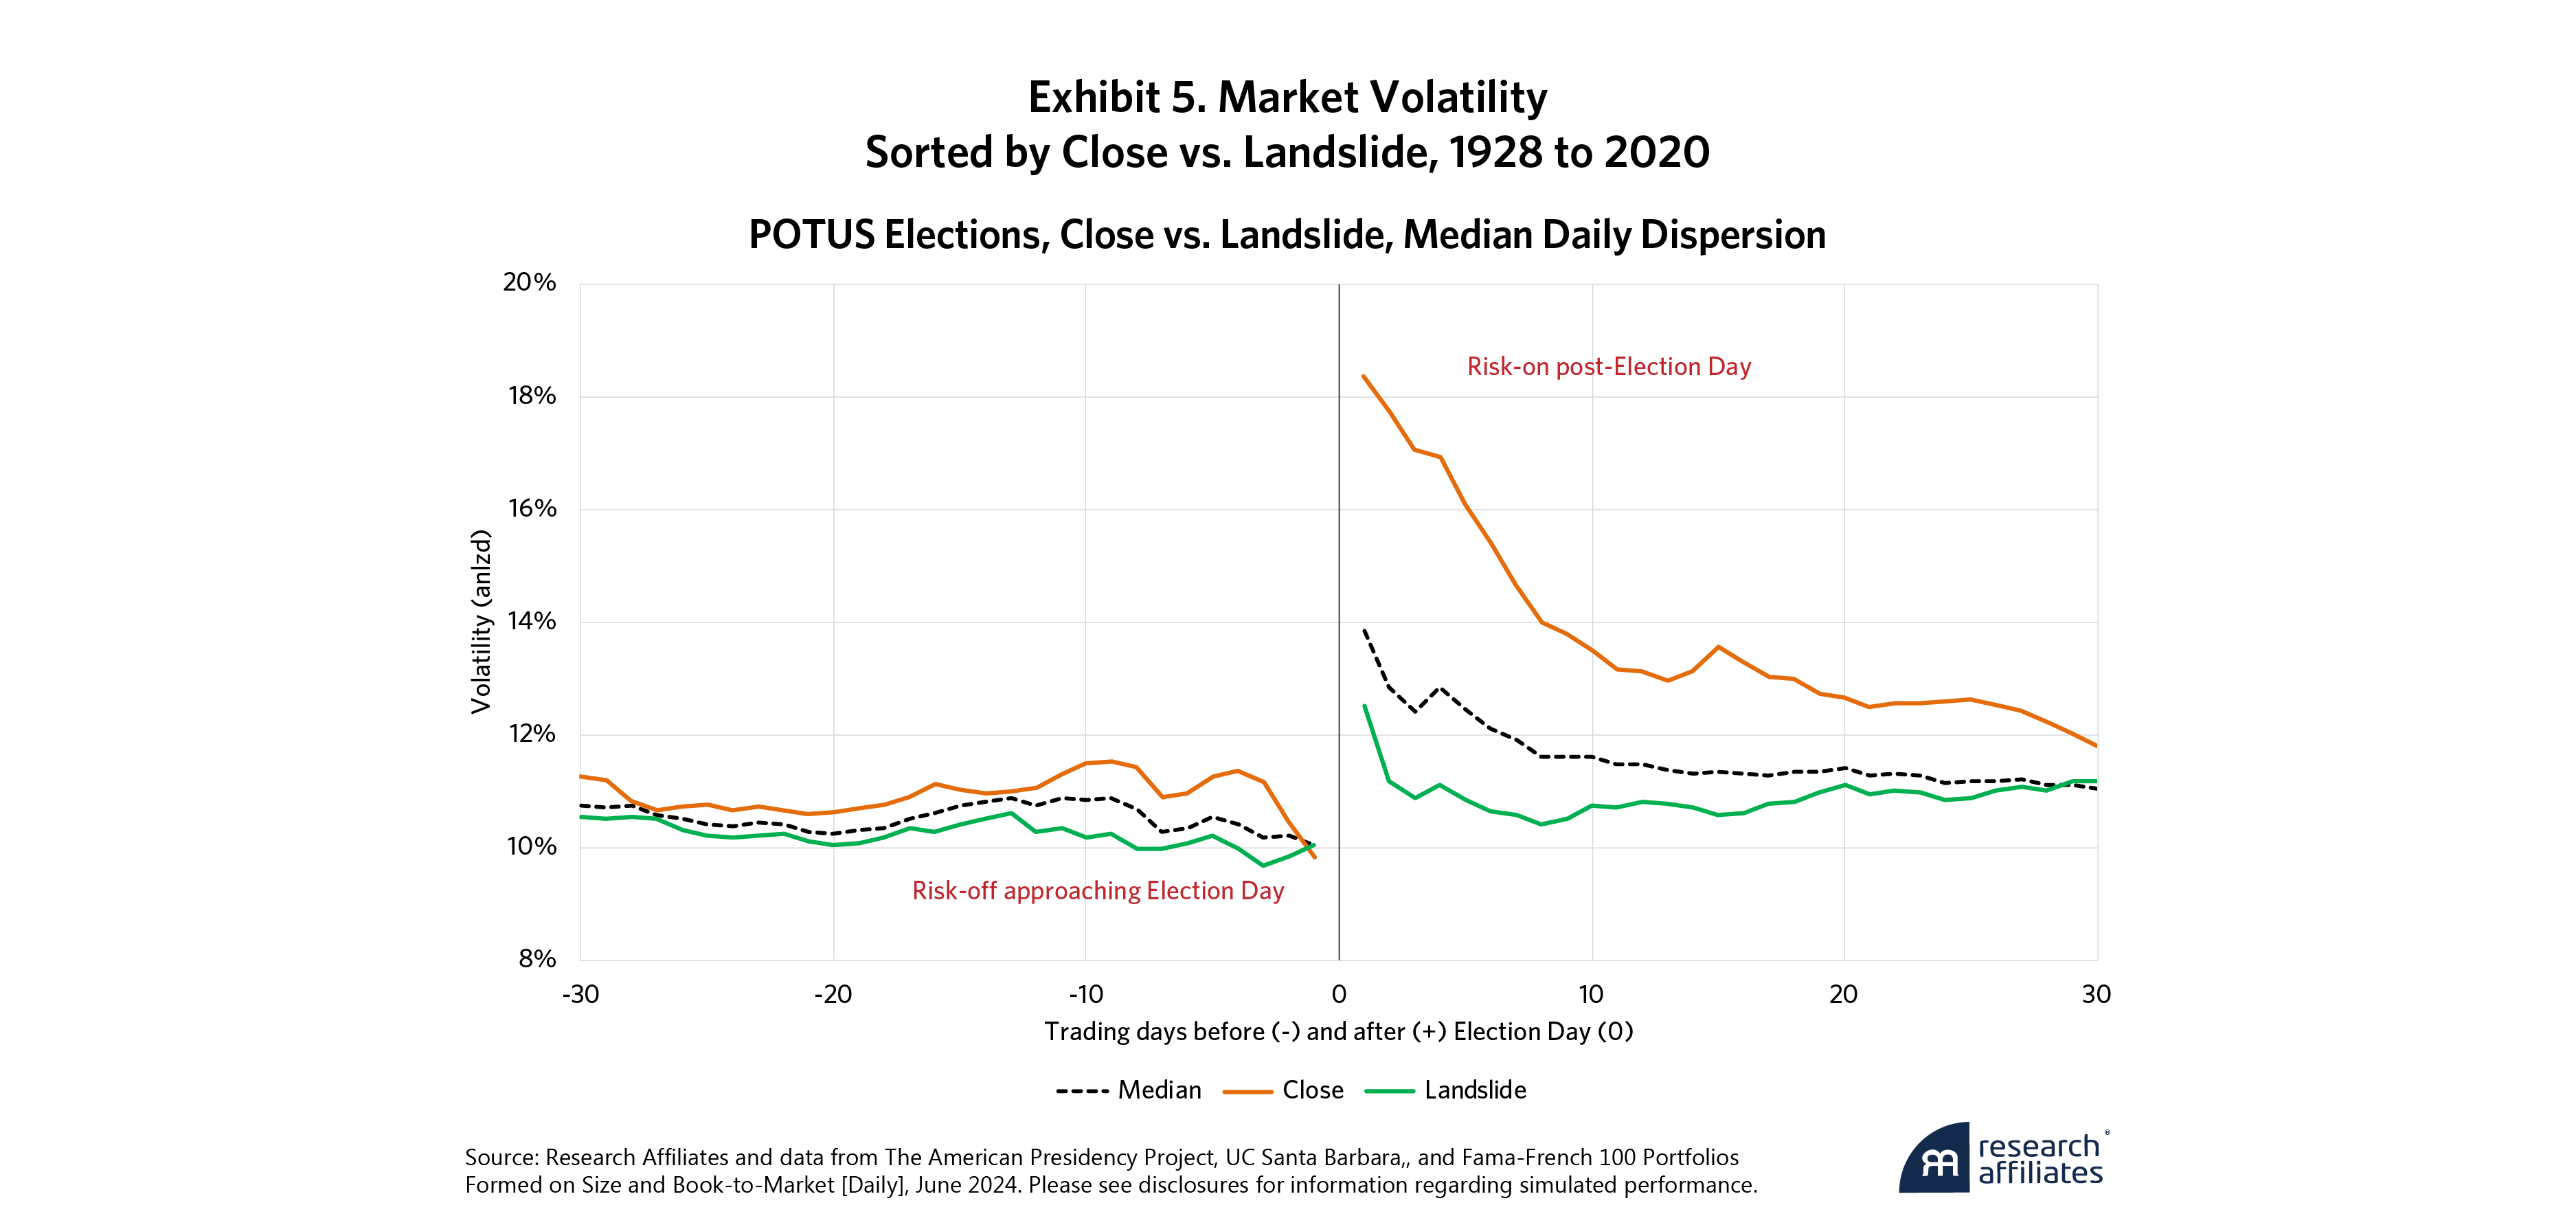
To measure daily market volatility, we use a proxy by calculating the cross-sectional standard deviation of returns for 100 portfolios formed by a double sort on market cap and book-to-market. Exhibit 5 shows the median standard deviation across these portfolios in close (orange line) and landslide (green line) elections.13 Volatility surges after tight elections, spiking on average from 10% before Election Day to 18% the first trading day after the election.
This is yet another example of the risk-off, risk-on pattern. When volatility spikes, it indicates that prices are making larger moves to incorporate new information and expectations. In the context of elections, a landslide victory is typically priced in by markets well in advance. On the other hand, a close election involves much higher levels of uncertainty, which leads to larger price movements and, thus, higher volatility once the winner is known.
Investment Takeaways
The good news? We can stop worrying about how elections will affect our investment portfolios. Whichever side we’re on in politics, the “wrong side” winning has yet to result in immediate catastrophe for the markets. As for the upcoming 2024 election, if we want to play a market-timing game, we might go risk-on in late October, with a tilt towards small-cap stocks after the election. Then, if our crystal ball gives us confidence that Kamala Harris will waltz into the White House, we should hang on to those Magnificent Seven stocks at least until Christmas. If, on the other hand, we expect Trump to roll back into the White House next year, we might want to pivot towards RAFI sooner rather than later.
But whoever wins, we should expect more volatile markets post-Election Day. That’s been a consistent theme in the two dozen presidential races going back to 1928. And if there’s anything that even Harris and Trump voters can agree on, it’s that this election will be close, and it will have consequences. Buckle up for what may be an interesting finish to 2024.
Please read our disclosures concurrent with this publication: https://www.researchaffiliates.com/legal/disclosures#investment-adviser-disclosure-and-disclaimers.

End Notes
1. Paul Krugman could have benefited from similar advice before famously predicting that Donald Trump’s upset victory in 2016 would lead to global recession. Despite the futures market plunging in overnight trading as news of Trump’s win sunk in, the stock markets staged a huge rally the next day. Krugman retracted his prediction in a later column, but the damage had already been done.
2. Because daily market performance data are unreliable before 1926, we do not go back further.
3. This is perhaps the exception that proves the rule: The market was down 12% in the first 30 trading days after the election. But the election wasn’t decided until the Supreme Court ruled on December 12. If we count that as “Election Day,” stocks were flat over the next 30 trading days.
4. We gauge market boredom by the cross-sectional volatility of 100 portfolios formed by a double sort on market cap and book-to-market, as we will discuss further in Exhibit 5. The 1972 election exhibited exceptionally low volatility, with 8% before Election Day and 10% the first trading day after. Both are well below the sample averages. Thus, the market was bored.
5. Pastor, Lubos, and Pietro Veronesi. 2017. “Political Cycles and Stock Returns.” University of Chicago unpublished working paper; and update to Santa-Clara, Pedro, and Rossen Valkanov. 2003. “The Presidential Puzzle: Political Cycles and the Stock Market.” Journal of Finance, 58 (5): 1841–1872. From 1861 to 1924, the opposite pattern prevailed, as markets generated better returns under Republican presidents.
6. Arnott, Rob, Brad Cornell, and Vitali Kalesnik. 2017. “Presidential Politics and Stock Returns,” Research Affiliates.
7. These are +/- two-sigma thresholds or a 95% two-tail significance interval range for the full sample. Null hypotheses are zero market excess return vs. T-bills, and zero size and value—SMB and HML—factor returns.
8. Note that even though our data set includes nearly 100 years of returns, it corresponds to 24 elections, which is slightly lower than the recommended thirty observations for tests of statistical significance.
9. In roughly half of the elections, a presidential race has “coattails” that lead to a “trifecta,” with the winning candidate’s party also taking or maintaining control of both the House and Senate. Republican and Democratic trifectas are special cases that we don’t cover here for brevity. There are enough samples of Democratic trifectas to draw interesting conclusions; however, the Democratic trifecta market outcomes resemble the broader Democratic wins. There have been only five Republican trifectas since 1928, so the results lack statistical significance and thus we do not show them. However, the empirical pattern is that Republican trifectas magnify the impact of Republican victories. For example, in the 30 trading days after a Republican trifecta, stocks surge and value stocks beat growth stocks handily.
10. Specifically small-minus-big cap stocks (SMB) and high-minus-low book/price ratio (HML).
11. Our 60 to 61 trading days (depending on the stock market being open on election day) is just shy of 91 calendar days, or 13 weeks, after including weekends and holidays.
12. Although we have been critical of this simplistic value definition, we utilized a publicly available dataset from Kenneth French’s website to ensure reproducibility and enable validation and extension of the findings.
13. Volatilities on Election Day are excluded by choice. Before 1984, the stock market traditionally closed on Election Day. In addition, medians are used instead of averages due to extreme outliers in dispersion from years such as 1932 and 2008.
