Many in the finance community assume a large equity risk premium of 5% or more. However, nothing in finance theory supports this expectation.
Forecasting the future ERP based on past excess returns is a mistake.
A statistically significant correlation exists between earnings yield and future stock market returns, offering critical insights for long-term investors.
Mean reversion is a powerful force: the further stocks stray from historical norms, the more likely they are to revert.
This is part of a series of articles adapted from my contribution to the 50th Anniversary Special Edition of The Journal of Portfolio Management.
Introduction
Many of the myths and controversies surrounding the equity risk premium (ERP) are rooted in semantics: The same term is used for multiple purposes. The difference between two backward-looking rates of return—stocks versus bonds or stocks versus cash, for example—is sometimes erroneously called the ERP. Historical return differences are not risk premia, because they reflect past returns, not return expectations, past or present. The “risk premium” must always be based on forward-looking return expectations.
Create your free account or log in to keep reading.
Myth: History Tells Us What Risk Premium We Should Expect
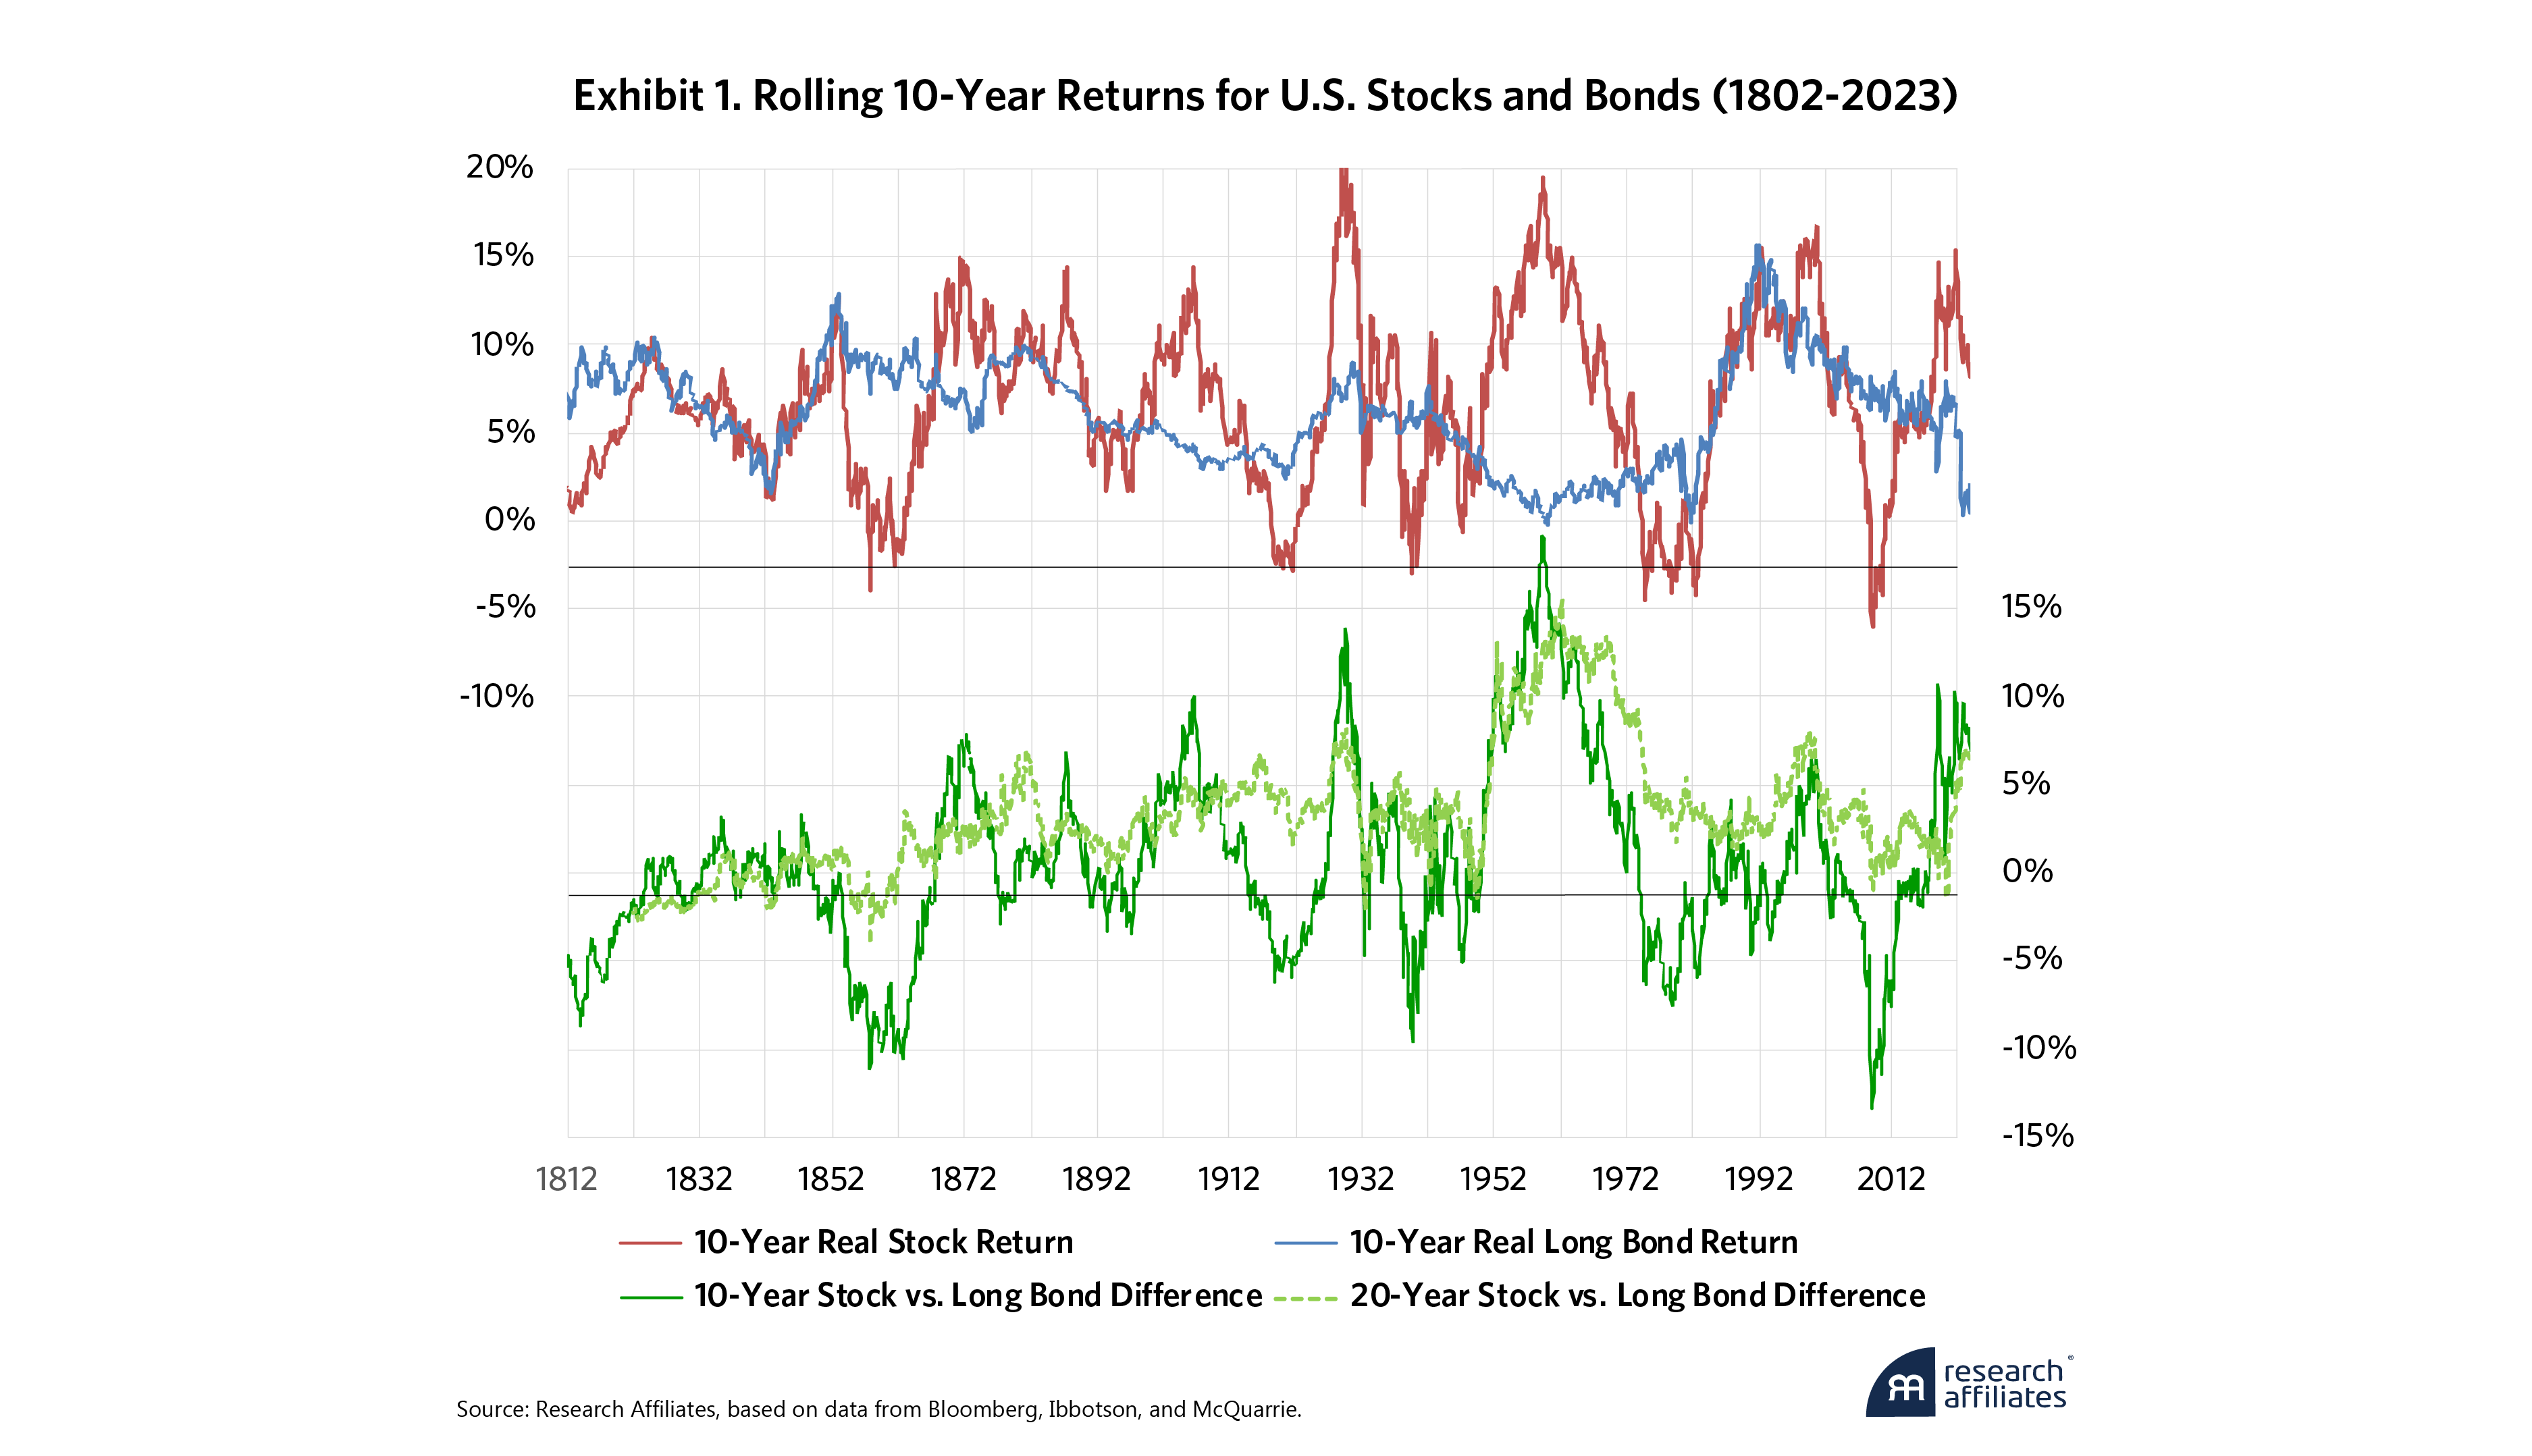
Backward-looking excess returns are hugely variable. Exhibit 1 shows rolling 10-year stock and bond market returns, and the difference between the two, over the past 222 years.1 The gap between rolling 10-year stock and long bond returns—the excess return for stocks relative to long bonds—ranges from +18.9% to –13.4% per year.2 For most of us, 10 years is a reasonably long investment horizon. Yet, few would consider a 19% annual risk premium reasonable, and no one would consider a –13% risk premium reasonable. These are backward-looking “excess returns,” not forward-looking risk premia.
Forecasting the future ERP by extrapolating past excess returns—even measured over scores of years—is a popular but pernicious blunder. Even so, much of the finance community sets return expectations in exactly this fashion. No wonder our industry got it so wrong at the peak of the dot-com bubble in 2000: The average corporate pension fund used an all-time high 9.5% “pension return assumption”—an important part of the earnings calculation—for conventional balanced 60% equity/40% bond portfolios. At a time when bond yields were 6%, this implies a 12% return expectation for stocks. With the stock market offering an all-time low 1.1% dividend yield, we would therefore need to expect double-digit growth in earnings, dividends, and share prices in the decades ahead in order to achieve a 12% expected return!3
Historical return differences are not risk premia, because they reflect past returns, not return expectations, past or present. The ‘risk premium’ must always be based on forward-looking return expectations.
”Myth: Long-Horizon Forecasts Are Hard
Knowing tomorrow’s weather with reasonable accuracy is easy. Knowing the weather a month, a year, or a decade hence is far harder. Because long-term forecasts are so very difficult for many things in life, we might readily expect that long-term capital markets return forecasts are similarly challenging. Not really. Anyone who confidently forecasts next year’s U.S. stock returns is either a fool or a shyster. But forecasting long-term returns over a decade or more is not difficult, albeit with some measure of error.
Any asset or market will produce returns in three ways: income (e.g., dividend or bond coupon), growth in income (zero for fixed income, negative for junk bonds due to defaults, and inflation-plus for stocks due to real growth in the economy), and changes in valuation multiples or spreads.4 Current income, the first component of long-term return, is usually easy: We know the yield of stocks, bonds, and other broad asset classes with some precision. Growth in income, the second component, is easy for some asset classes and not for others. Past growth in income can be a useful guide, particularly if we are careful to distinguish between real growth and nominal growth. Stock market dividends have rather steady real growth, with more uncertainty in their nominal growth. Investment grade bonds have extremely steady nominal income, with zero growth, less some negligible defaults, and corresponding uncertainty in real growth. Most asset classes also tend towards mean reversion in valuation multiples or spreads, the third component of returns.
Anyone who confidently forecasts next year’s U.S. stock returns is either a fool or a shyster. But forecasting long-term returns over a decade or more is not difficult, albeit with some measure of error.
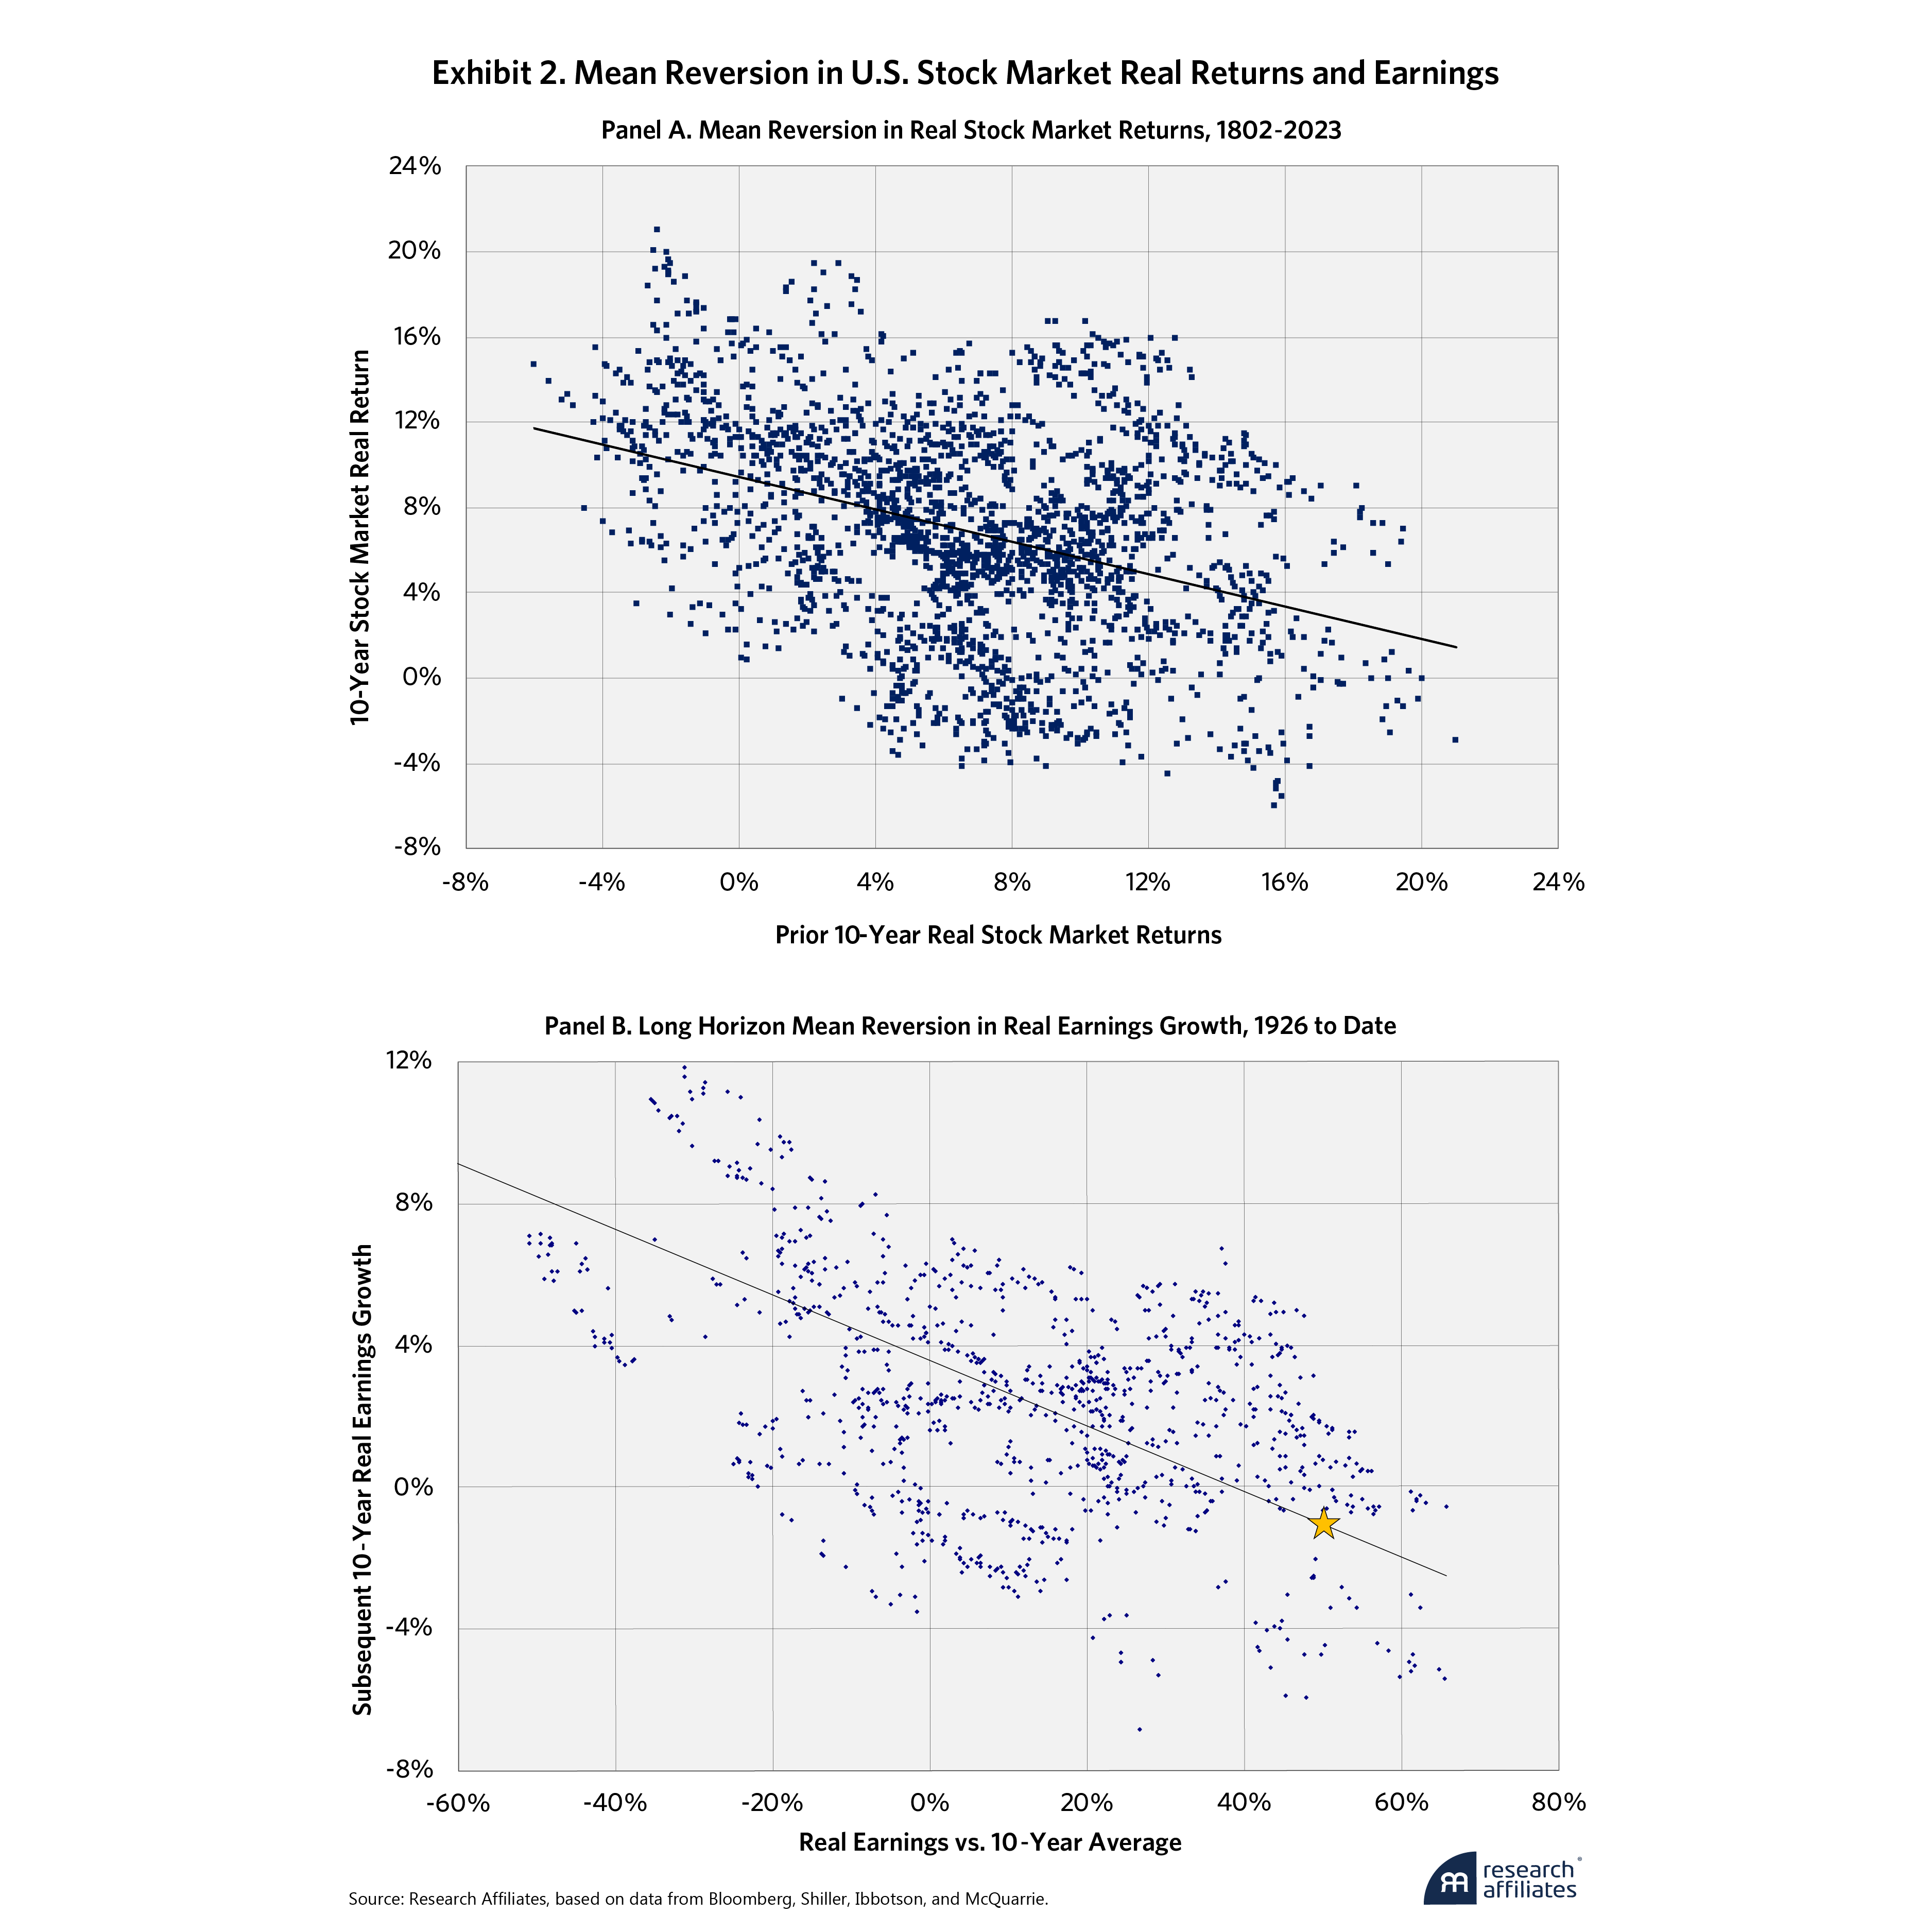
”In Exhibit 1, historical stock and bond returns and the difference, stock-versus-bond excess returns, randomness is paired with mean reversion. The further we depart from the historical norm, the more likely the next move will be towards that historical norm. Panel A of Exhibit 2 looks at U.S. stock returns in isolation, comparing 10-year real returns with the previous 10-year real returns. Over the past 222 years, the correlation between prior and subsequent rolling 10‑year real stock market returns has been a whopping –38%. When stocks offer terrific real returns in one decade, they tend to reverse course over the next decade, and vice versa. This correlation is both statistically significant and economically meaningful. This correlation is central to Jeremy Siegel’s core thesis in Stocks for the Long Run (1994).
Over the Ibbotson Associates span (1926 to date), the same pattern recurs with real earnings growth in Panel B, only more so, with a –55% correlation. The mid-2024 level of real earnings—marked with a gold star—is 50% above the 10-year average, well into the historical top decile; history suggests that we should expect little growth in the coming decade, no matter how ebullient Wall Street earnings projections may be. In the world of finance, capital markets and macroeconomics, time series rarely fail to exhibit long-term mean reversion.
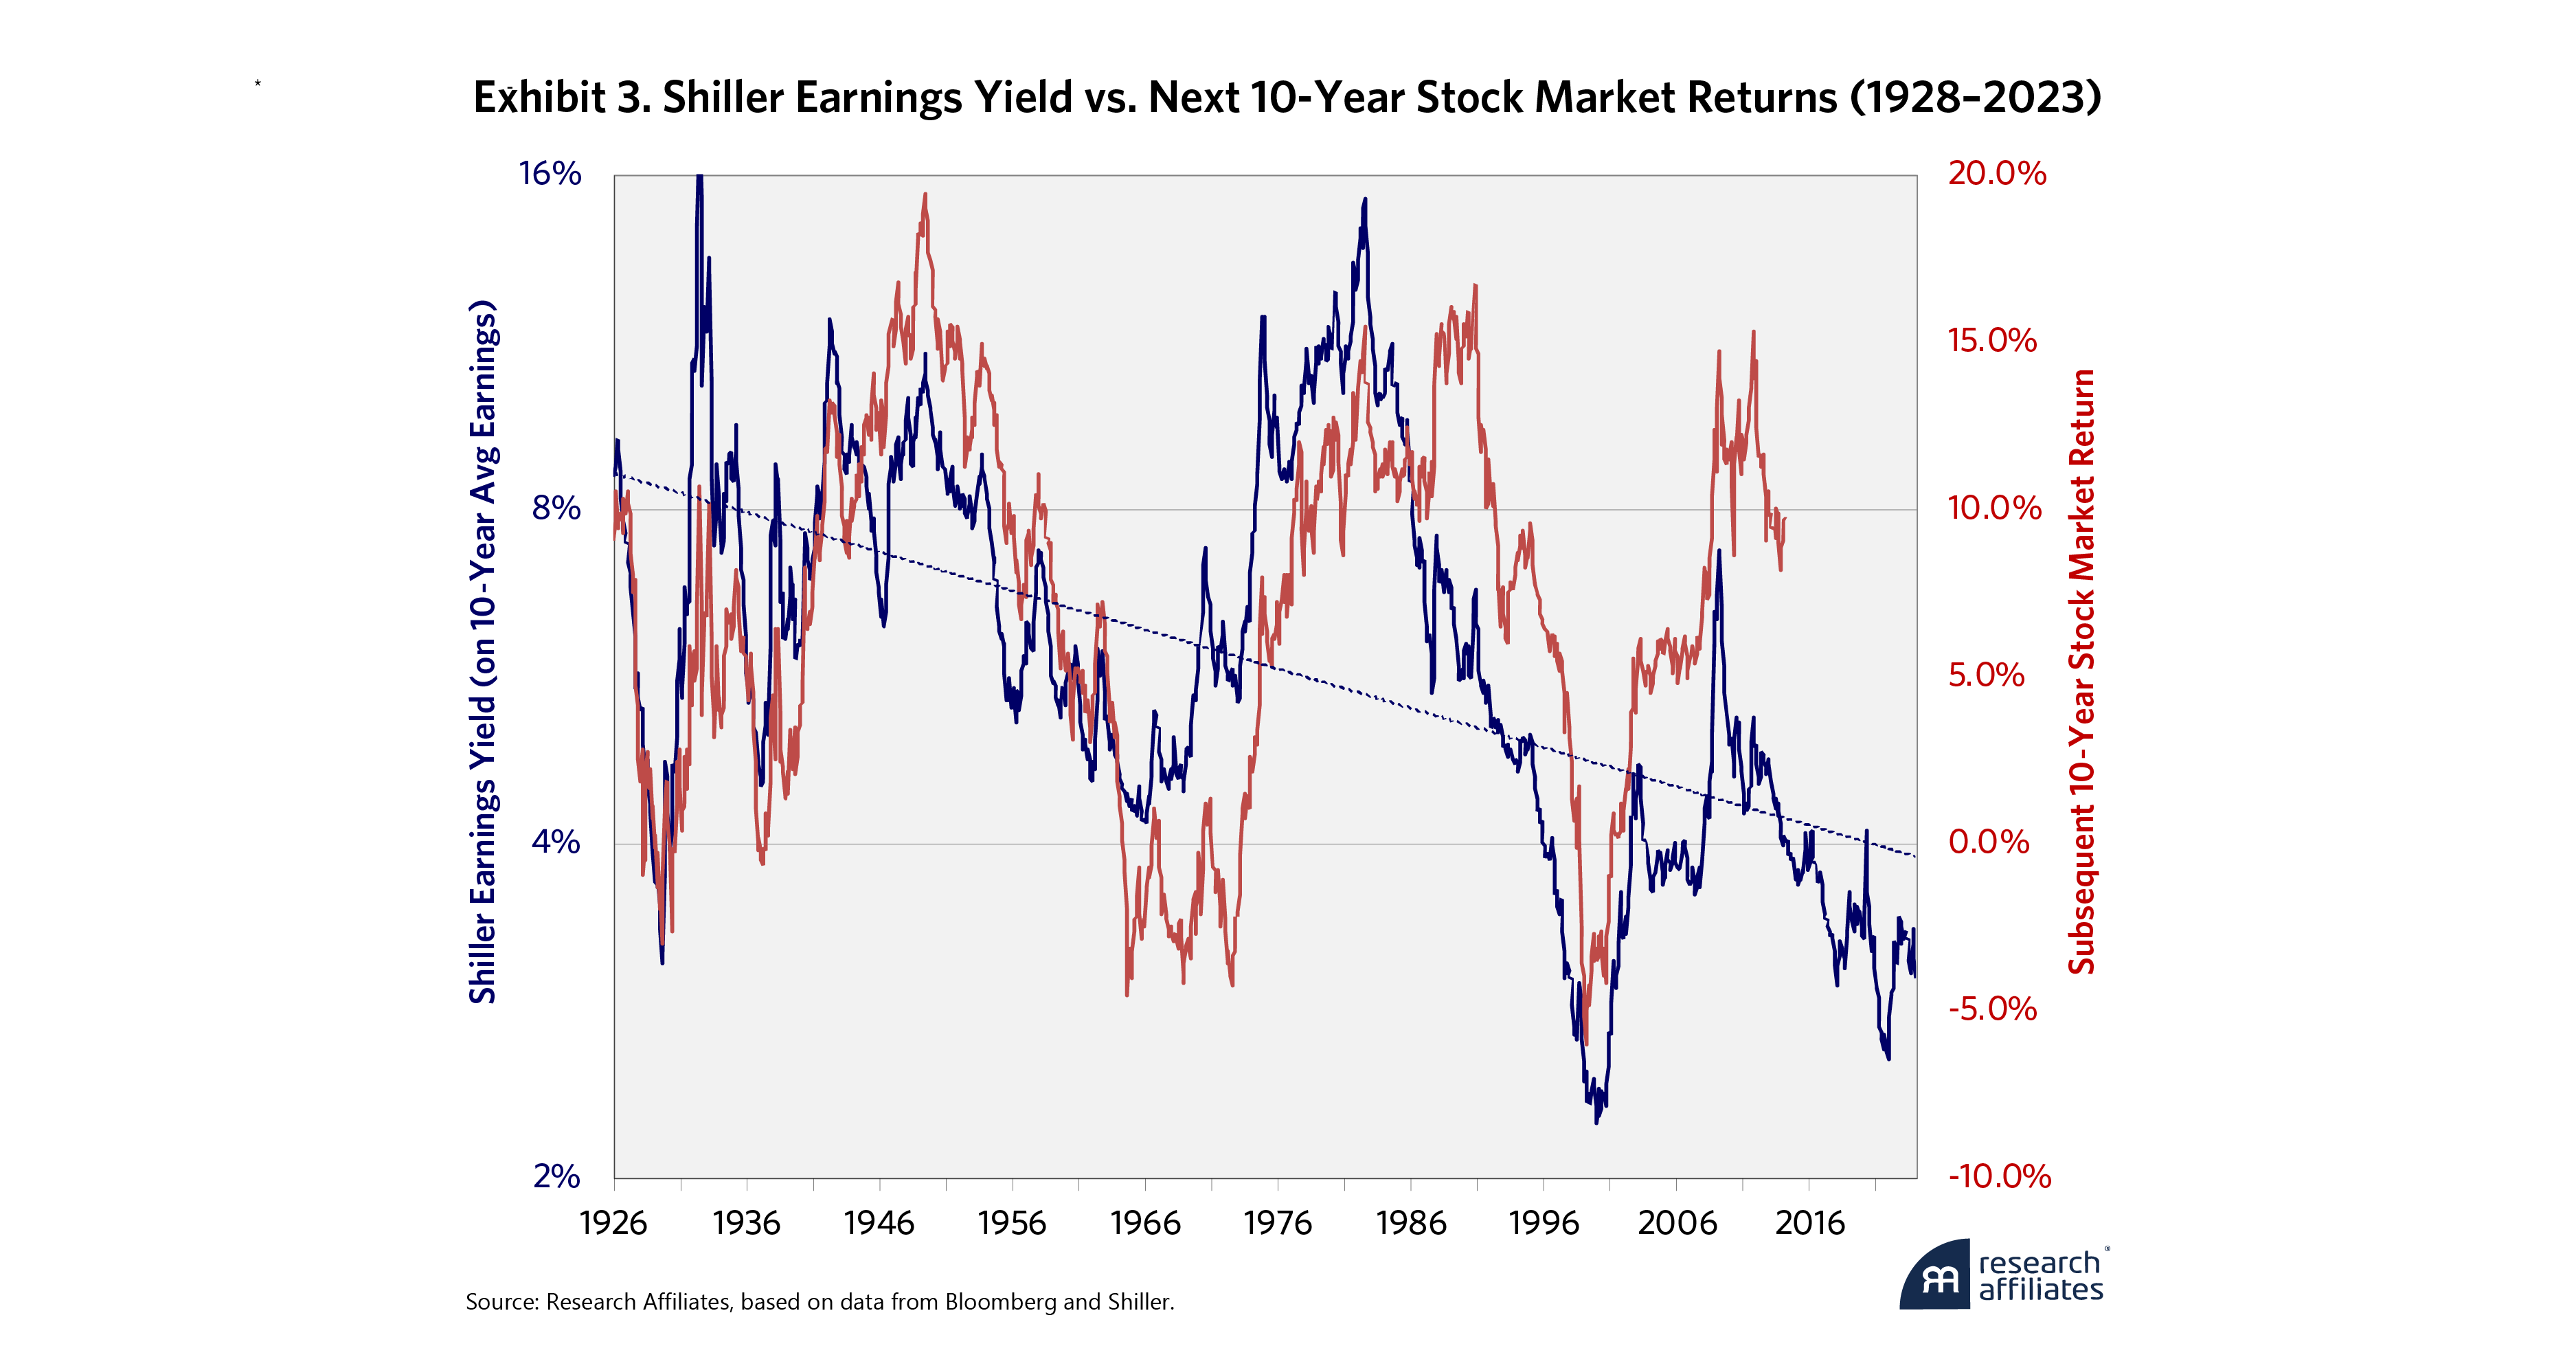
Another powerful example of long-horizon mean reversion can be seen in Exhibit 3, which compares the earnings yield of the S&P 500 (in blue on the left scale) with its subsequent 10-year total return (in red on the right scale). In this exhibit, we use 10-year smoothed earnings, rather than far more volatile trailing 12-month earnings or forward earnings expectations. This is the reciprocal of the cyclically adjusted price-earnings (CAPE) ratio pioneered by John Campbell and Robert Shiller (1988). The red line shows the mean reversion in 10-year stock market returns that we saw previously, in Exhibit 2, Panel A, in a different way.5
Note that we are using a log scale for the Shiller earnings yield. The log scale tacitly acknowledges that a doubling of the earnings yield should be roughly equally important, from any given starting level. Put another way, we should expect to see far more difference in forward returns if the earnings yield rises from 3% to 5%, for example, than if it rises from 10% to 12%.
The blue line shows a powerful tendency for long-horizon mean reversion in the CAPE earnings yield, around a pronounced trend. Our economy has become more prosperous, with a better social safety net, longer life expectancy, and other changes that should increase investor risk tolerance. When investors have a higher collective risk tolerance, we should expect lower yields and correspondingly lower subsequent return expectations. Accordingly, the “normal” earnings yield—and ERP—towards which we see long-horizon mean reversion, has likely drifted lower.
The correlation between earnings yield and subsequent stock market returns is undeniable and statistically significant. This has a direct bearing on forecasting stock market returns and the risk premium. When earnings yields are high, so too are subsequent stock market returns. When earnings yields are low, so too are subsequent returns. The trend in the earnings yield very likely means that the mid-2024 earnings yield of 3% is not as dangerous as it would have been in past decades.6
In forming long-term future return expectations for markets—capital market assumptions (CMA) or capital market expectations (CME)—we follow a simple protocol. The yield is whatever it is. Historical growth in income is taken to be a reasonable estimate for future growth in income. Here, we try to distinguish between assets that have reasonably steady real income (e.g., stocks and TIPS) and those that have reasonably steady nominal income (e.g., bonds). For changes in valuation multiples or spreads, we recognize that mean reversion may or may not occur, so we assume halfway mean reversion over a leisurely 10-year span. Apropos of the previous discussion of a trend in the “normal” earnings yield for stocks, we assume that mean reversion for any asset class is towards a detrended normal. Applied to different asset classes over the past 50 years, this method has a less than 2% average error in 10-year return forecasts. Even in volatile markets like stocks, REITs, and commodities, the average error rarely exceeds that 2% threshold by much.7
Myth: History Shows That the Equity Risk Premium Is About 5%
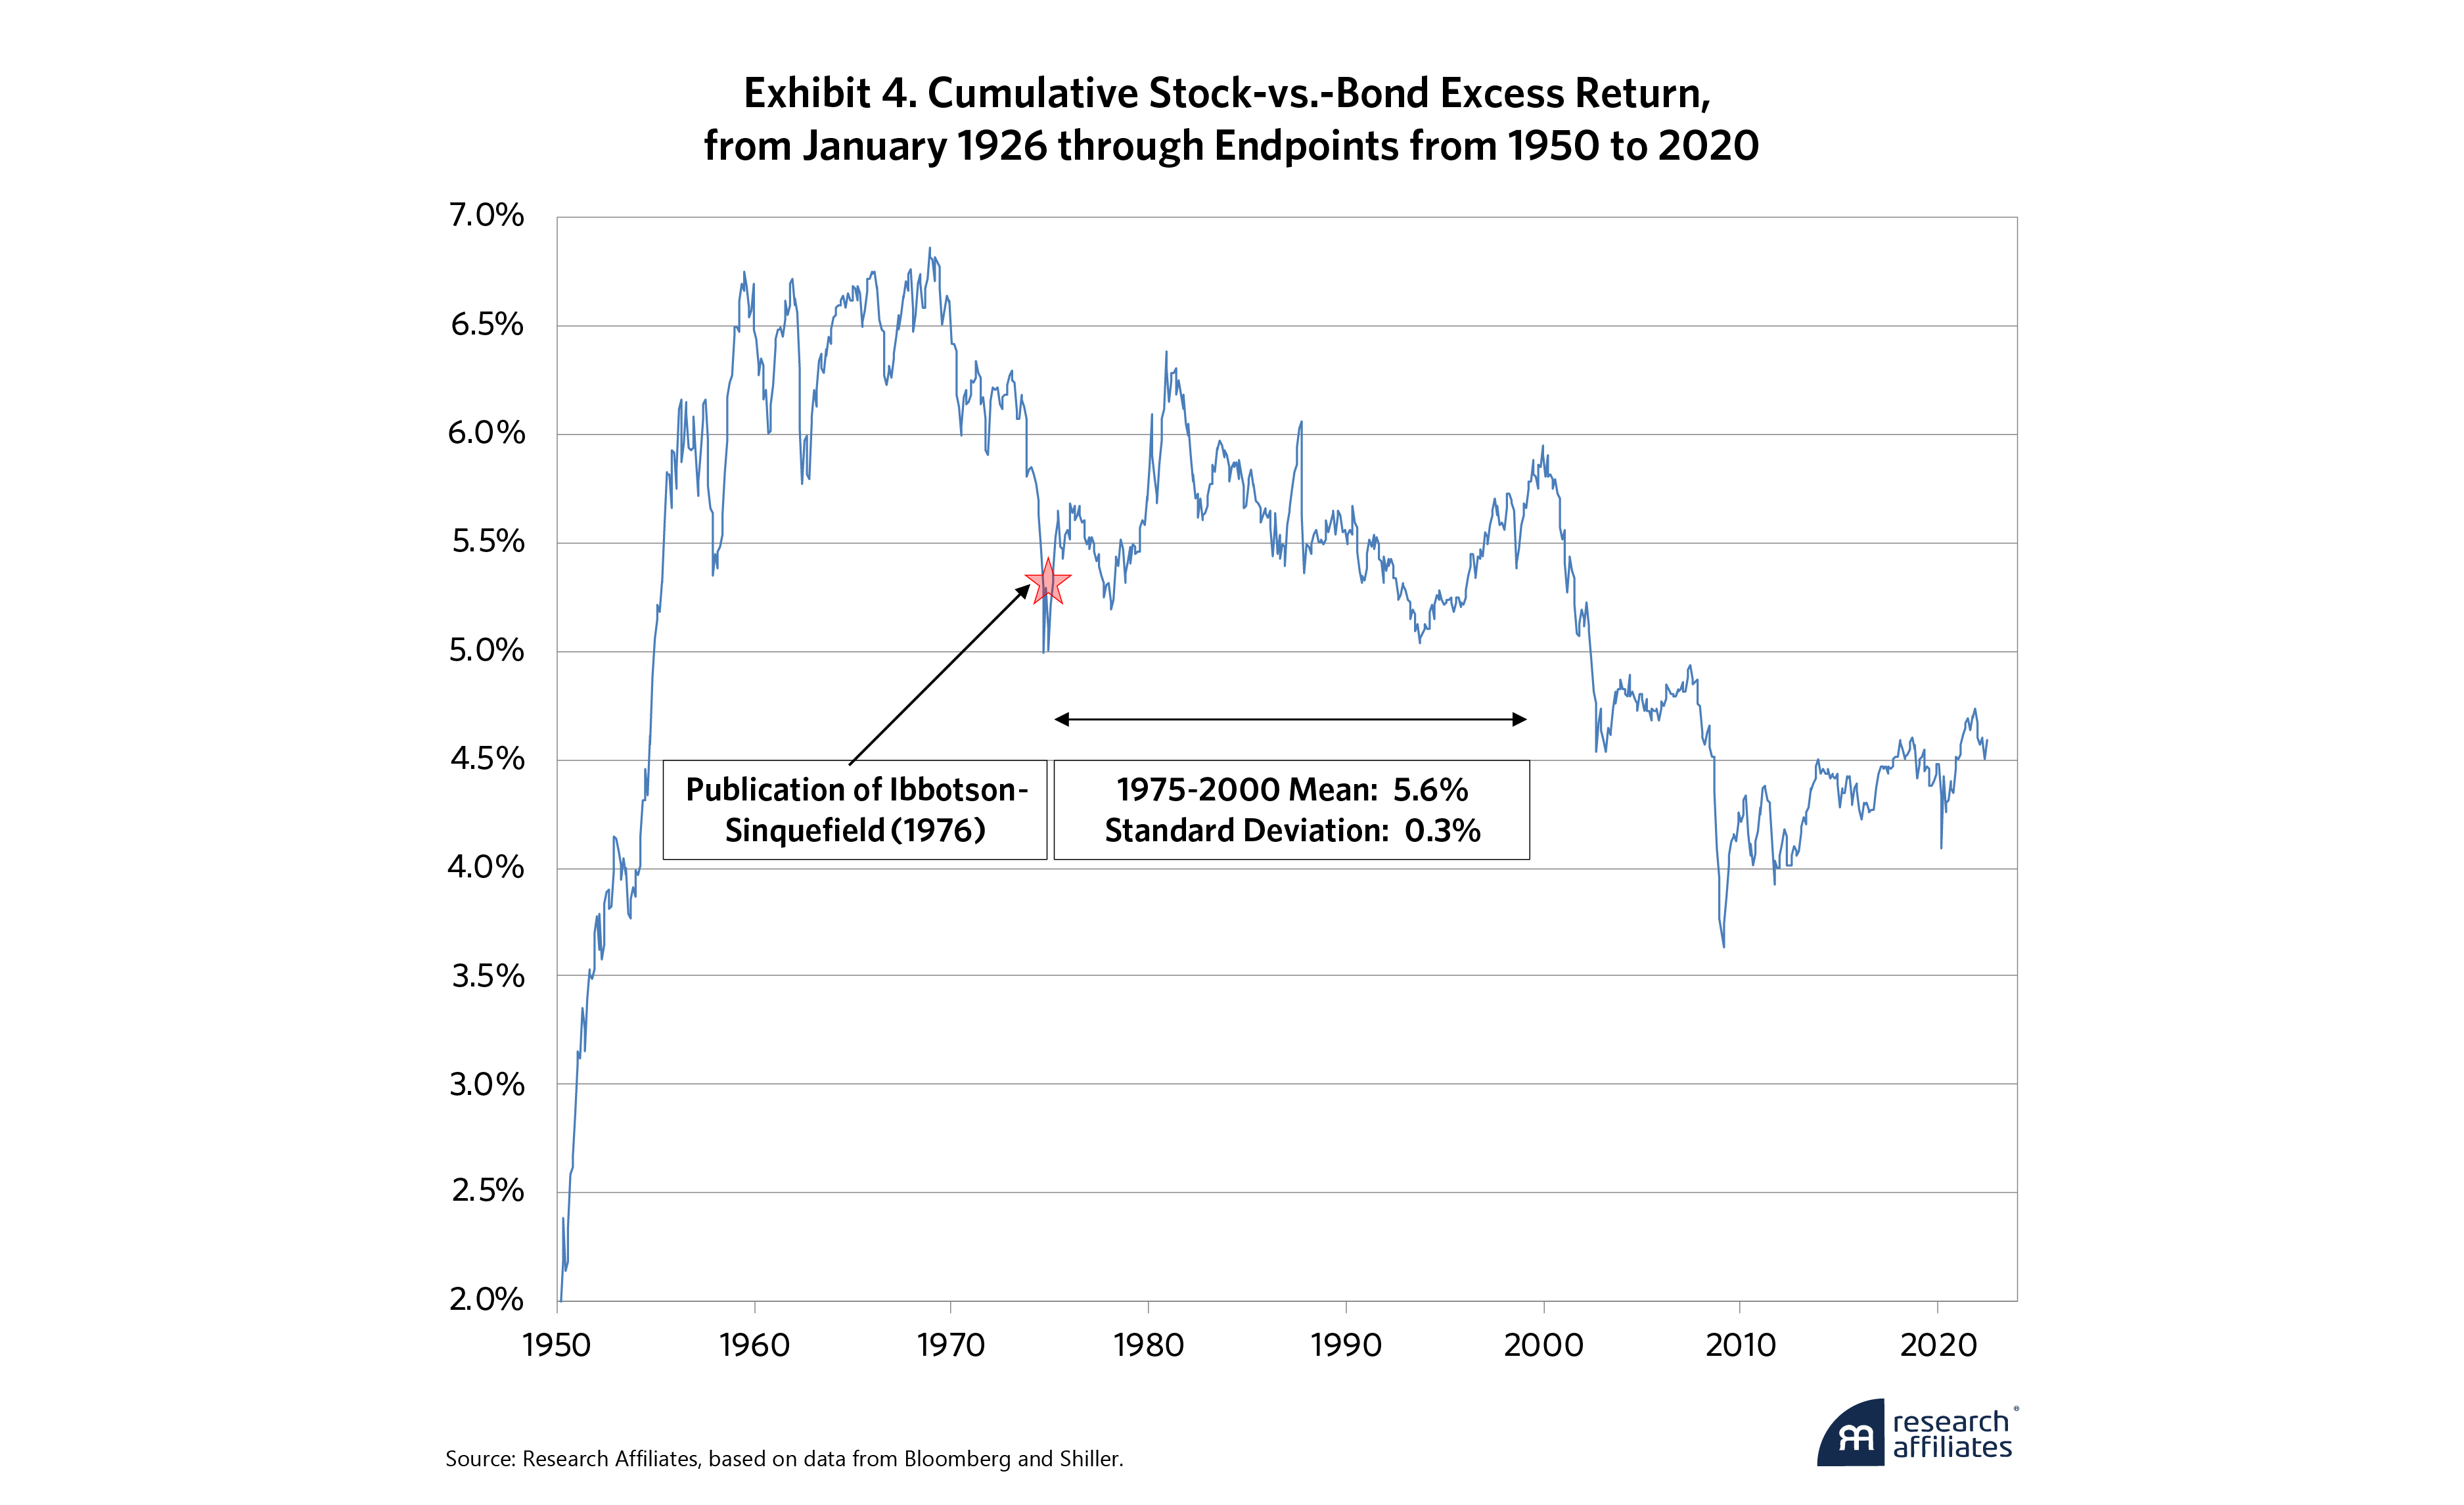
Nothing in finance theory requires such a large equity risk premium, but the notion of a large risk premium—and a 5% ERP is large!—has been used to justify some truly heroic growth assumptions when yields or payout ratios were low. This myth has its roots in the seminal 1976 Ibbotson and Sinquefield article that showed a 5.3% compound excess return for stocks relative to bonds from 1926 to 1974, as highlighted by the red star in Exhibit 4. It stands at the exact midpoint of the full span from 1926 through 2023. All the excess returns—the blue line—are from the same starting point, January 1926. The leftmost point in Exhibit 4 is the 2% excess return for the 24 years from 1926 through 1949; the rightmost point is the 4.5% excess return for the 98 years from 1926 through 2023. A quarter century after the period covered by Ibbotson and Sinquefield, the excess return for stocks relative to bonds (now from 1926 to 1999) had risen modestly to 5.9%. In the intervening quarter century, that cumulative excess return—always from a 1926 starting point—created an illusion of out-of-sample confirmation, almost always with an excess return between 5% and 6%. Even now, at 4.5% at year-end 2023, over nearly a century, the past excess return is still very near the 5% holy grail.
Of course, nothing in this graph is out of sample: The seed period from 1926 to 1974 is always at least half of the sample from 1974 through last year. That stable excess return is a consequence of overlapping samples, paired with a tremendous upward revaluation of equity markets. But, in the last half of the 20th century, the U.S. stock market experienced an upward revaluation, whether measured by price-earnings ratios or dividend yields, to valuation multiples never seen before or since. Revaluation is a presumably non-recurring contributor to return—either positive or negative, depending on the direction of revaluation—and hence to the stock market excess returns over bonds.
Even this most recent 4.5% excess return is a poor basis for shaping future expectations even if it covers 98 years. At year-end 2023, the stock market commanded 70 times its dividend income, a 250% upward revaluation from its a price/dividend ratio of 20 at the start of 1926. Even over 98 years, that’s equivalent to a 1.3% annual upward revaluation. Absent rising valuation multiples, the 98-year history would have delivered an excess return of 3.2%, not 4.5%. Should we count on ever-rising valuation multiples in the years ahead? If not, shouldn’t our expected risk premium be 3.2%, not 4.5%?
It gets worse. The current dividend yield is 1.4%, far below the 3.8% average yield of the past 98 years. As future returns begin with a 1.4% dividend yield, not 3.8%, should we not also reduce this historical excess return by that 2.4% difference, to 0.8%?
The point of this exercise is not to suggest that we should set our current expected risk premium at a scant 0.8%, based on sensible adjustments to the 4.5% observed excess return over the past 98 years. My point is that past returns, even over a span longer than most of us can hope to live, are a terrible way to set return expectations.
Myth: The Equity Risk Premium Is More-or-Less Static
Proponents of this myth argue that, when dividend yields go down, it’s because growth expectations are rising pari passu, leaving the ERP largely unaffected. Nothing in neoclassical finance theory suggests that the ERP must be static. Moreover, behavioral finance proponents reject a static ERP, because risk expectations, investment horizons, personal financial circumstances, and hence risk tolerance are all nonstationary, both for individuals and for society at large.8
Myth: The “Equity Premium Puzzle”: Stocks Beat Bonds by More Than They Should
For the rational long-term investor, most utility functions suggest that only a modest equity risk premium—at most 1% to 2%—should be required, to be willing to invest a large chunk of net worth into the stock market. This is framed as a puzzle because it assumes that investors do indeed require a continuing 5% expected risk premium to accept stock market risk. But a rational homo economicus would need to be profoundly risk averse to require a 5% expected risk premium in order to willingly embrace stock market risk.
This is no puzzle at all. This lofty excess return was earned in part because of huge gains in stock market valuation multiples. Rising valuation multiples were never part of the return expectation for rational homo economicus. Absent upward revaluation to still-lofty current valuations, the excess return for stocks relative to bonds or cash would have been far lower. In my work with Peter Bernstein (2002), we find that the historical average expected equity risk premium would have been around 2.4%, roughly half as large as the historical average excess return.
Myth: If Your Investment Horizon Is 20 Years, You Almost Can’t Lose with Stocks
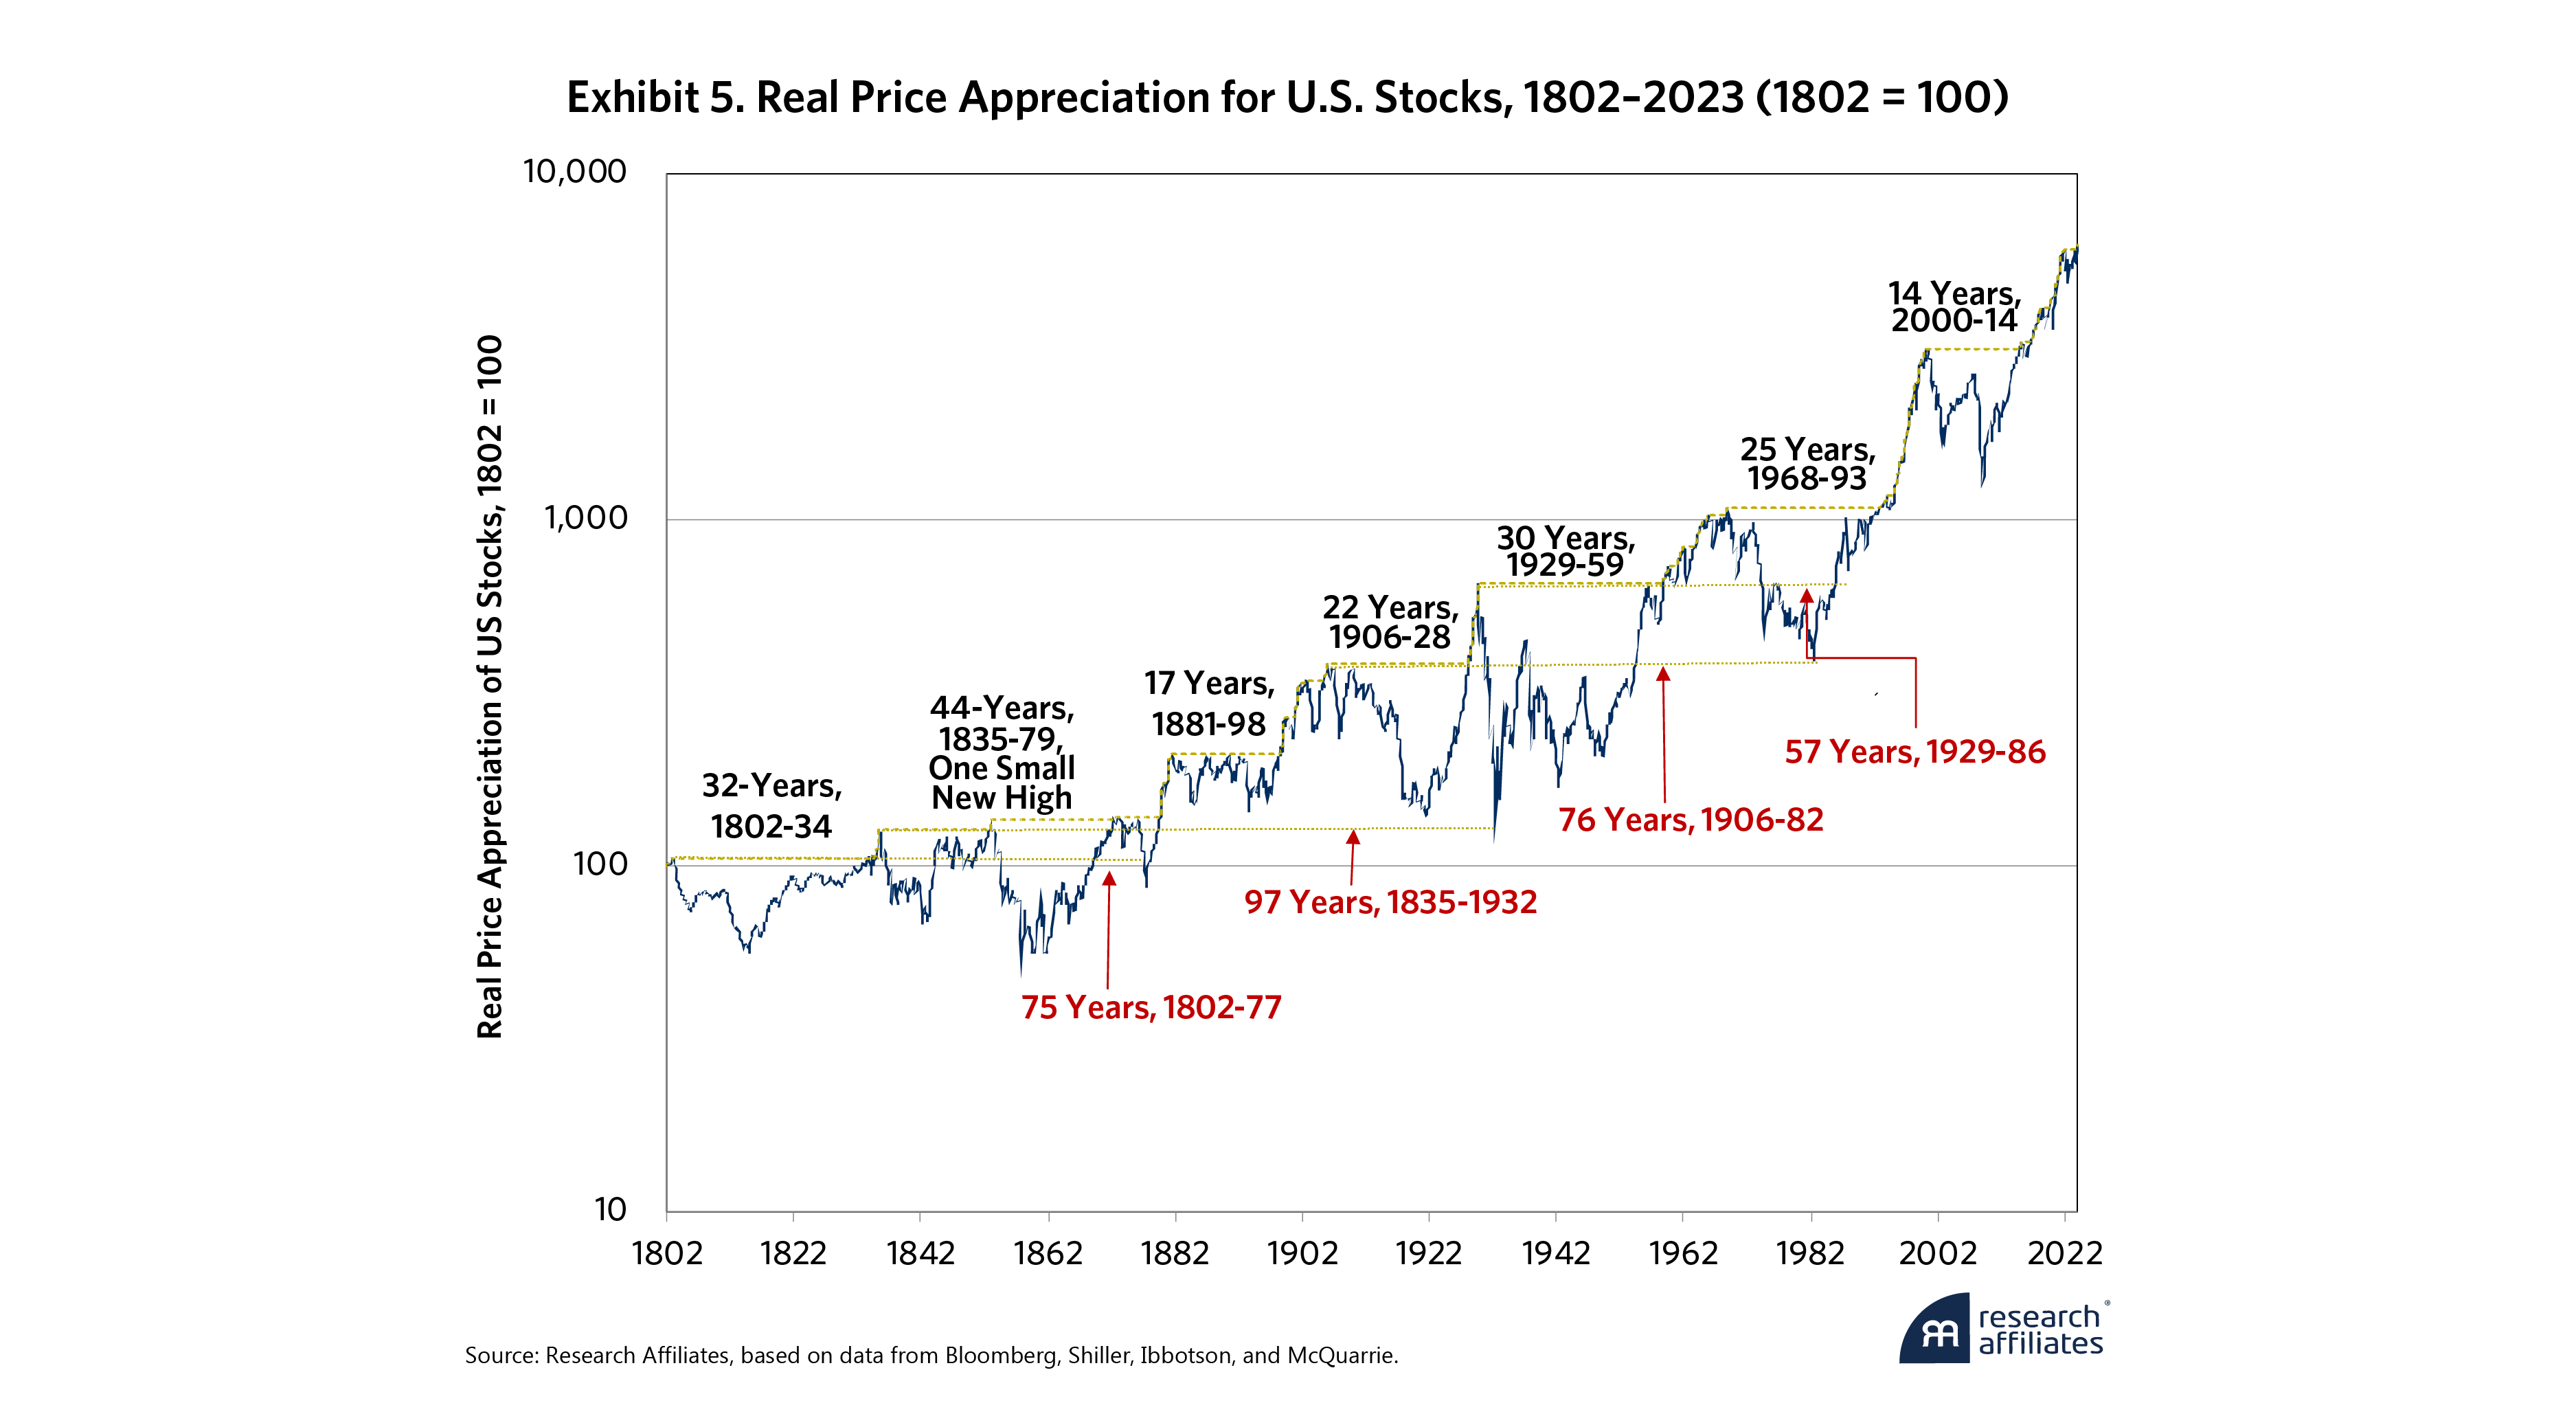
Our industry largely ignores the low but hardly negligible possibility of negative real returns over a shockingly long span. This myth lingers despite a very recent 22-year span, from 1999 to 2021, in which the returns of ordinary long U.S. T-bonds eclipsed those of the S&P 500, and a 14-year span, from 1999 to 2014, in which the S&P 500 index, net of inflation, never recovered from the dreadful first decade of the 2000s.
Few would bear equity market risk in exchange for dividend income alone, with no real price appreciation, especially when that income is a now minimal 1.3%. Exhibit 5 tracks the price-only appreciation of U.S. stocks, net of inflation.9 It demonstrates that roughly once every generation stocks enjoy a stupendous bull market, rising to a new high that is roughly twice the previous high, in real terms. In the intervening years, spanning over 80% of the past 222 years, investors waited, often for decades, in a different sort of “punctuated equilibrium,” hoping for the market to claw its way back to prior peaks. Once a secular bull market came to an end, that wait took an average of 26 years.
Indeed, some of these bear markets are so daunting that their troughs take us below ancient peaks from prior generations, so that those peaks are not lastingly exceeded for multiple generations. A stock market investor who began in 1802 saw the market fall below 1802 levels again and again, never lastingly exceeding that level until 1877, longer than they could reasonably hope to live. Indeed, the great crash from 1929 to 1932 took the market almost back to 1802 levels, net of inflation, despite 100-fold growth in U.S. GDP over that span. That’s 130 years of stock market investors earning little more than the dividends. We are obviously intentionally choosing an important market top and a horrific bear market low, to identify this longest-ever span with almost no real price appreciation for U.S. stocks. Still, not even Jeanne Calment, who died at the ripe old age of 122, lived long enough to earn convincingly more than the dividend yield in that tumultuous era. Non-U.S. examples abound, with protracted periods in which stocks underperform bonds and/or cash, sometimes for far longer spans than anything seen in U.S. history.
Yes, stocks should earn both a meaningful real return and a risk premium relative to bonds and cash. No, we are not at all assured that they will do so in any given 10-year, 20-year, or even considerably longer span. We call it a risk premium for a reason!
Myth: Dividends Do Not Really Matter; When Yields and Payout Ratios Are Low, the Retained Earnings Will Produce Faster Earnings Growth
In an efficient market, investors will accept a lower yield when they believe future real growth in earnings will make up the difference. True in theory, but empirically false. This myth has two components. First, it suggests that retained earnings deliver incremental growth sufficient to compensate for the lower dividend distributions. Second, the myth implies that lower yields go hand in hand with higher growth expectations. Overwhelming global evidence indicates a strong positive link between the dividend yield and both the subsequent real return for stocks and the subsequent excess return of stocks relative to bonds. This led Peter Bernstein (2005) to refer to dividends as fresh orange juice and retained income (ostensibly wisely reinvested) as frozen orange juice. No one has ever said it better!
The Franco Modigliani and Merton Miller indifference theorem is often used to further justify this myth. But Modigliani and Miller is a theory based on a large array of simplifying assumptions and, therefore, only approximates reality. Do lower payout ratios lead to faster earnings growth? Arnott-Asness (2003) shows that higher payout ratios on the broad market are consonant with higher—not lower—earnings growth. ap Gwilym, et al. (2006) replicate and confirm our findings out of sample, in seven developed economies. It would seem that a dollar retained is less valuable than a dollar distributed to the shareholders. This makes intuitive sense: The reinvestment opportunities available to shareholders are far more diverse than those available to corporate management.
Yes, stocks should earn both a meaningful real return and a risk premium relative to bonds and cash. No, we are not at all assured that they will do so in any given 10-year, 20-year, or even considerably longer span. We call it a risk premium for a reason!
”Myth: Shareholders Earn the Sum of Tax-Advantaged Stock Buybacks and Dividend Distributions.
This myth is a little tricky. Yes, buybacks are typically more tax-efficient than dividends. But they are not additive. While both will be funded out of company cash (or borrowings), stockholders do not receive both. To receive the buyback, an investor must sell the stock. The company is spending its capital to reduce the shares outstanding, the float, as a form of reverse dilution. But buying back stock does not make continuing shareholders richer any more than new share issuance makes them poorer. This trade only boosts earnings per share (EPS) if the return on invested capital (ROIC) for internal reinvestment in the business materially exceeds the cost of the buyback capital. The recent years of negative real interest rates were a golden era for buybacks, as the real cost of capital for the most creditworthy companies was negligible or even negative.
Buybacks are also tricky because there are true and false buybacks. In false buybacks, management redeems stock options and the company buys back a like number of shares to facilitate the redemption. This is management compensation in drag. What’s the incentive for management? Self-interested management will want to redeem when it thinks the stock is overpriced. With true buybacks, management wants to reduce its float and increase its EPS. With a true buyback, management should try to buy when the share price is too low, ideally with costless capital (borrowed at negative real rates). The shareholder is made richer not by the buyback but by the company eventually delivering more future growth in the underlying business, which benefits shareholders with real price appreciation and/or higher dividend income.
Myth: Stock Market Earnings Grow Roughly as Fast as GDP in the Very Long Run
This is true in aggregate but not on a per share basis. As experienced by stock market investors, per share earnings historically have grown much slower than GDP, except when buybacks have been unusually popular, as during the Michael Milken leveraged buyout (LBO) years in the late 1980s and during the recent period of negative real interest rates.
Aggregate corporate profits measured as a share of GDP tend to be reasonably stable when averaged over long periods of time. However, not all of these profits flow to shareholders in existing companies. Our economy is far more dynamic than that. The growth in aggregate corporate profits consists of growth in existing enterprises plus the creation of new enterprises. The sum of the two roughly matches GDP growth, but shareholders only participate in the growth of existing enterprises. Since “new enterprises” often account for real GDP growth, the ERP is smaller than adherents to this misconception expect.
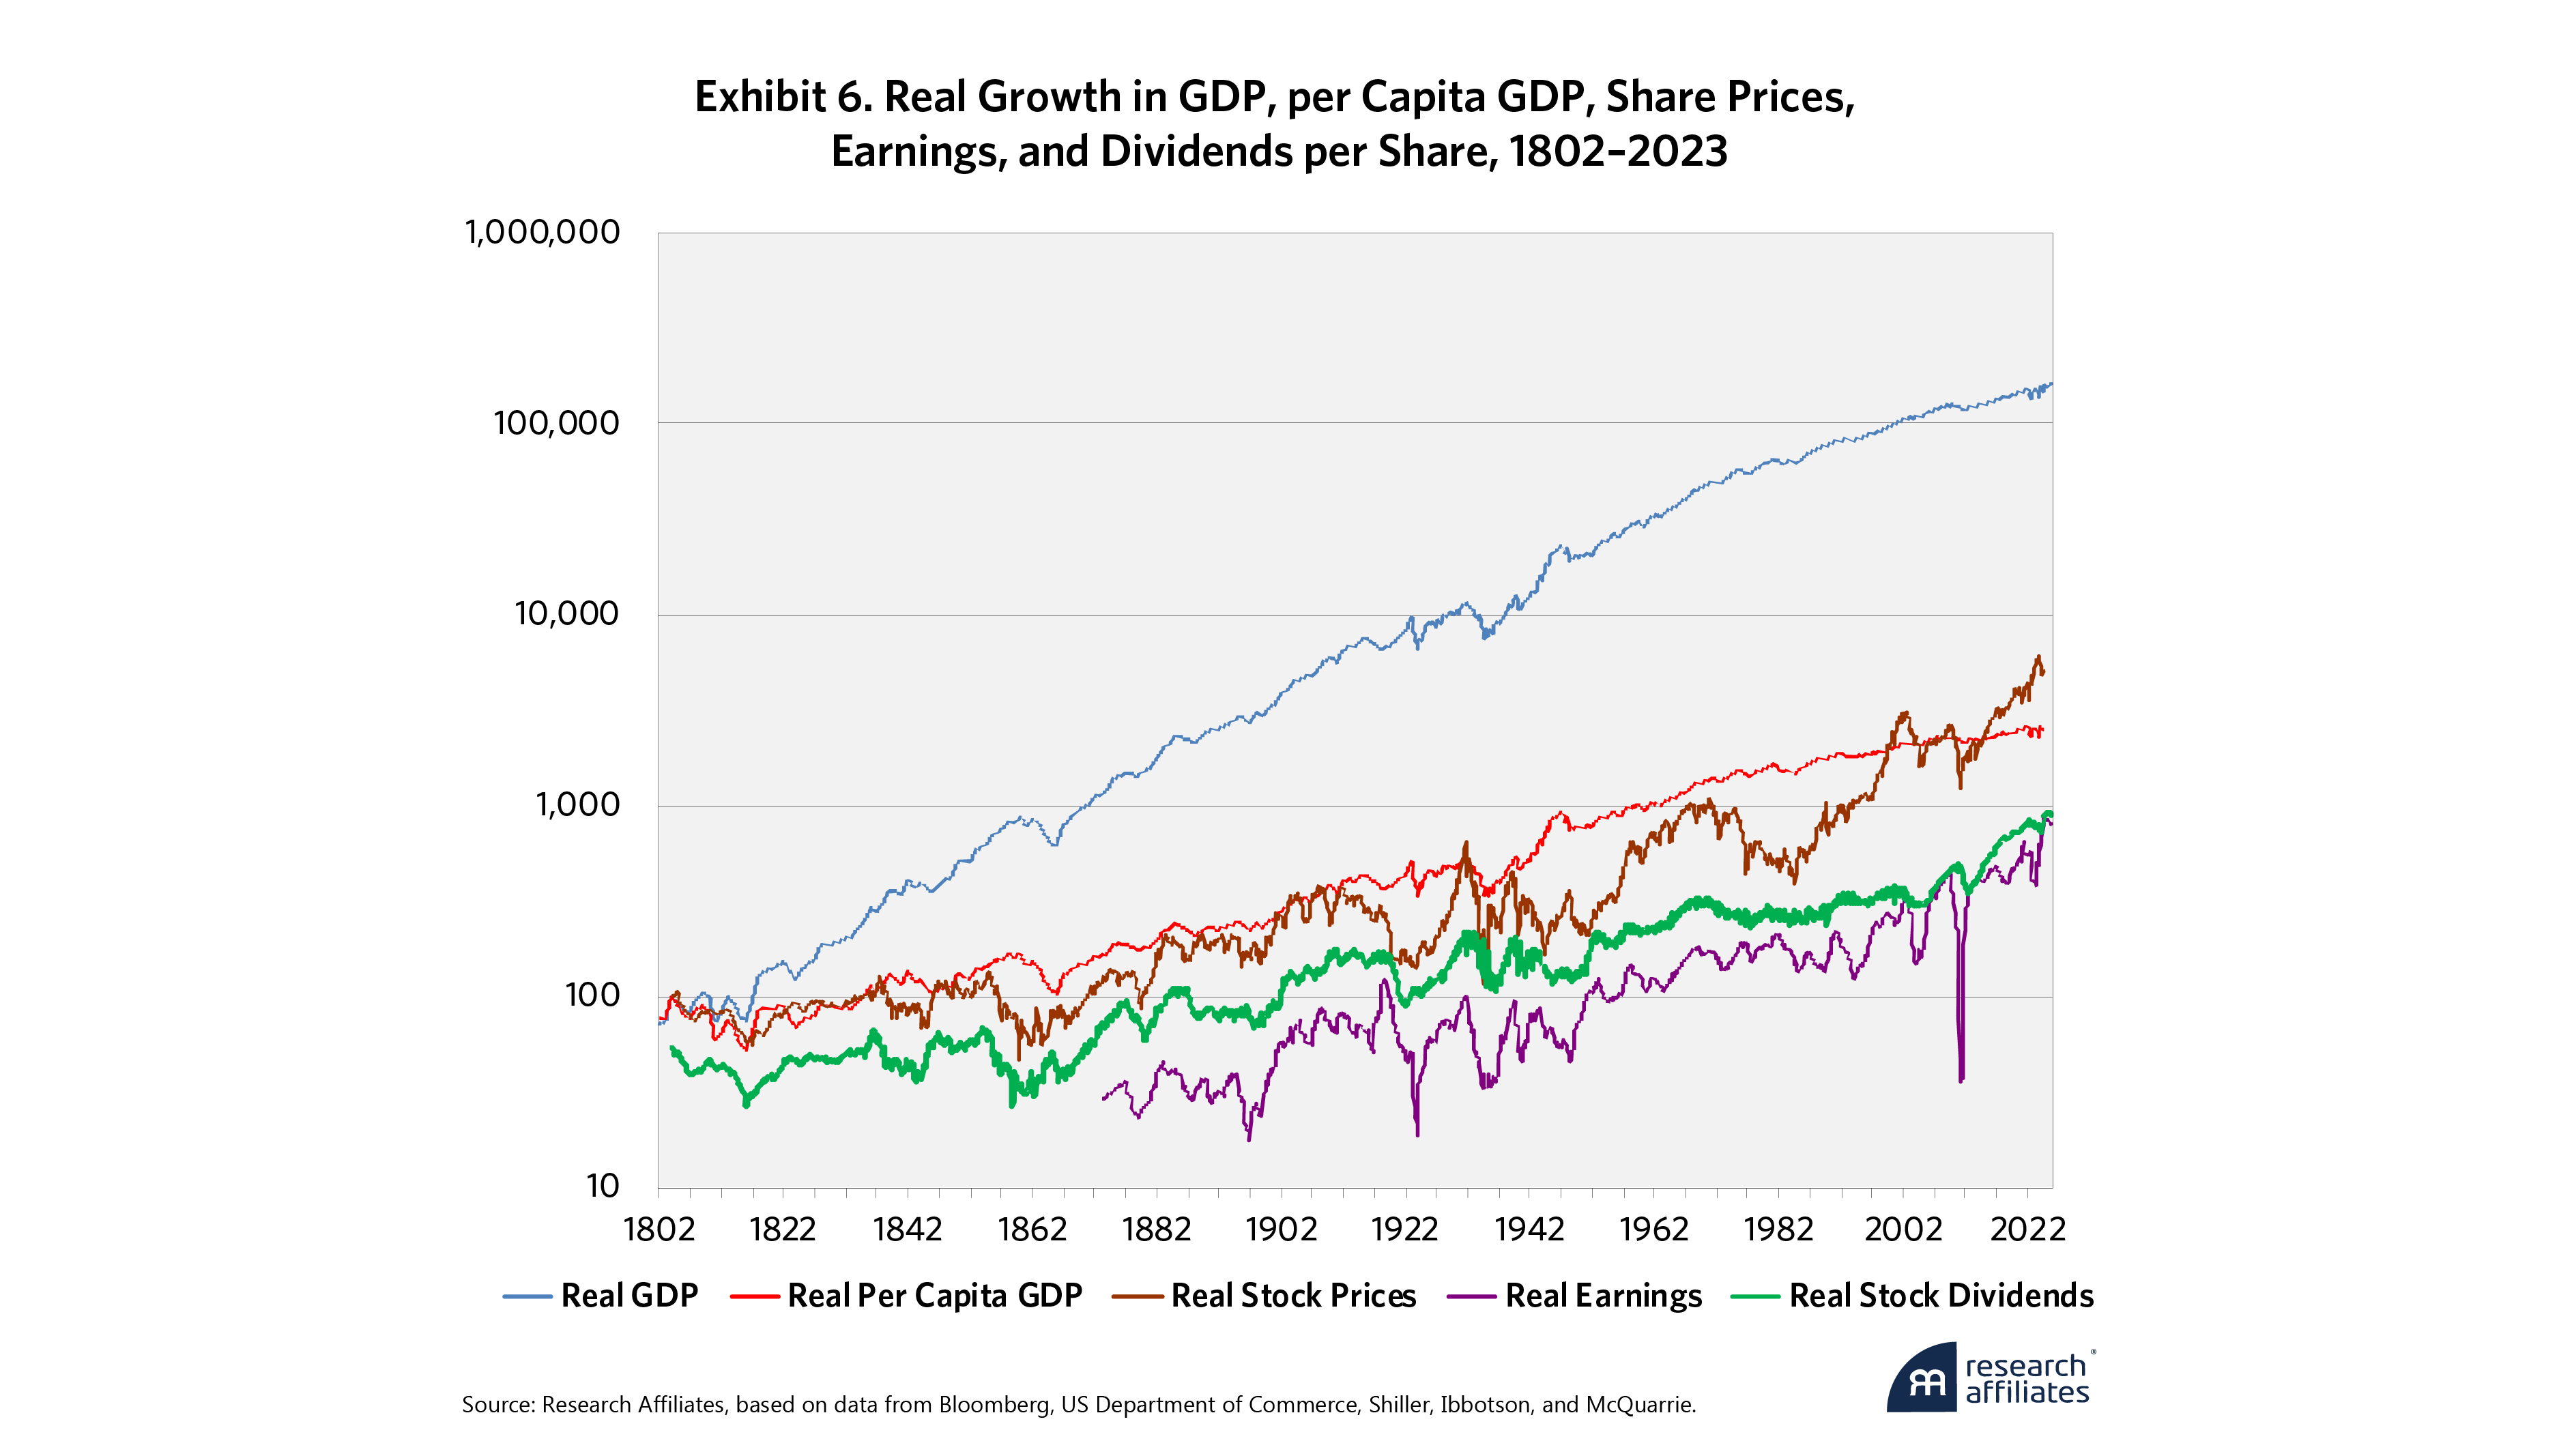
Exhibit 6 shows that the 1600-fold growth in real GDP since 1802 equated to 25-fold growth in per capita real GDP, because the population grew over 60-fold over this span. The real price appreciation and per-share earnings growth for stocks grew modestly faster than per-capita real GDP growth; per share dividends grew modestly slower. But, in contrast to the widely held view that earnings, dividends, and share prices should grow with aggregate real GDP growth, these growth rates were largely similar to per capita real GDP growth, tacitly implying that simple population growth should not reward shareholders. Why should we expect this? As William Bernstein and I speculated in 2003, this myth makes no sense, because it would mean that rewards to capital grow much faster than rewards to labor, which would likely be political kryptonite.
Bernstein-Arnott (2003) shows a 2% dilution, with earnings and dividend growth running about 2% behind GDP growth due to entrepreneurial capitalism. During the widespread adoption of a zero interest rate policy (ZIRP) environment following the global financial crisis (GFC), this pattern reversed. New enterprise creation slowed and the number of publicly traded companies in the United States halved from its 1997 peak until the pandemic lows.
Conclusion
Most ERP myths resemble classic urban legends. They are so seductively plausible that they linger despite overwhelming evidence to the contrary. Most of these myths can be used to rationalize a higher, not a lower, ERP. No one seems to want to construct a myth or a fable that might lead us to expect lower returns!
Please read our disclosures concurrent with this publication: https://www.researchaffiliates.com/legal/disclosures#investment-adviser-disclosure-and-disclaimers.
End Notes
1. For the Sisyphean task of tracking down historical stock and bond market returns, back to 1926, 1871, and finally 1802, we are indebted to Alfred Cowles (1939), Roger Ibbotson and Rex Sinquefield (1976), William Schwert (1990), and Edward McQuarrie (2023).
2. We relied on railroad bonds during the brief period when no Treasury bonds existed.
3. There may also have been a cynical aspect to this “expectation,” as some pension plan sponsors may have known the forecasts were too high but used them anyway to avoid having to increase contributions to their pension plans.
4. I’m obviously not including “assets” like cryptocurrencies because they pay no income and never will. I view such assets as speculative vehicles: We buy them if we think someone will pay more in the future. I see nothing wrong with speculative vehicles, but I do not consider them to be investments. I think this distinction can help us to avoid costly errors.
5. While long-horizon mean reversion seems self-evident, these data from 1926 through 2023 have too few non-overlapping samples to be statistically significant. Longer studies and panel regressions spanning multiple countries confirm that mean reversion is statistically significant.
6. It is unsurprising that a detrended earnings yield is an even tighter fit with subsequent 10-year returns than the raw earnings yield. While the mid-2024 earnings yield of 3% is hardly a comfortable level, it is much closer to the historical trend than previous major market peaks like 2000 or 1929. Today's earnings yield suggests caution, not cataclysm.
7. For those who are curious to learn more, the researchaffiliates.com website has a free "Asset Allocation Interactive" tool that uses these methods to forecast returns for well over 100 different asset classes.
8. There are many illustrative examples that would justify shifting risk aversion, hence shifting risk premia. Consider demographics: A 35-year-old who expects to live 25 years (1900 demographics) will be far more risk-averse than a 35-year-old who expects to live 45 years (2024 demographics). Consider also financial well-being: After a severe recession, investors collectively will probably be more risk-averse.
9. Let’s not forget that the taxable investor is taxed on the inflation component of stock and bond market returns. In a world of elevated inflation and low yields, this can deliver zero after-tax total returns shockingly easily.
References
Gwilym, O., J. Seaton, K. Suddason, and S. Thomas. 2006. “International Evidence on the Payout Ratio, Earnings, Dividends, and Returns.” Financial Analysts Journal 62 (1): 36–53.
Arnott, R. D., and C. S. Asness. 2003. “Surprise! Higher Dividends = Higher Earnings Growth.” Financial Analysts Journal 59 (1): 70–87.
Arnott, R. D., and P. L. Bernstein. 2002. “What Risk Premium Is ‘Normal’?” Financial Analysts Journal 58 (2): 64–85.
Bernstein, P. L. 1997. “What Rate of Return Can You Reasonably Expect … or What Can the Long Run Tell Us about the Short Run?” Financial Analysts Journal 53 (2): 20–28.
Bernstein, P. L. 2005. “Dividends and the Frozen Orange Juice Syndrome.” Financial Analysts Journal, 61 (2): 25–30.
Bernstein, W. J., and R. D. Arnott. 2003. “Earnings Growth: The 2% Dilution.” Financial Analysts Journal 59 (5): 47–55.
Campbell, J. Y., and R. J. Shiller. 1988. “The Dividend-Price Ratio and Expectations of Future Dividends and Discount Factors.” Review of Financial Studies 1 (3): 195–227.
Campbell, J. Y., and R. J. Shiller. 1988. “Stock Prices, Earnings and Expected Dividends.” The Journal of Finance 43 (3): 661-676.
Cowles, A. 1939. Common Stock Indexes: 1871–1937. Bloomington, IN: Principia.
Ibbotson, R. G., and R. A. Sinquefield. 1976. “Stocks, Bonds, Bills and Inflation: Year-by-Year Historical Returns (1926–1974).” Journal of Business 49 (1): 11-47.
McQuarrie, E. F. 2023. “Stocks for the Long Run? Sometimes Yes, Sometimes No.” Financial Analysts Journal 80 (1): 12–28.
Miller, M. H., and F. Modigliani. 1961. “Dividend Policy, Growth, and the Valuation of Shares.” Journal of Business 34 (4): 411–433.
Schwert, G. W. 1990, 1991. “Indexes of United States Stock Prices from 1802 to 1987,” Journal of Business, 63 (3): 399–426. Correction: Journal of Business, 64 (3): 442.
Shiller, R. J. 2000. Irrational Exuberance. Princeton, NJ: Princeton University Press.
Siegel, J. J. 1994. Stocks for the Long Run. New York, NY: McGraw-Hill.
