Asset Allocation Interactive at 10 Years: The Good, the Not Too Bad, and the Ugly
Research Affiliates launched Asset Allocation Interactive (AAI) 10 years ago as a free source for capital market expectations (CMEs) based on current fundamentals.
The recent performance of the U.S. stock market and the 60/40 portfolio has bucked the trend of fundamentals and led many to question the usefulness of long-term CMEs. This skepticism, combined with AAI’s 10-year anniversary, offers an opportunity to assess the value of fundamentally derived CMEs.
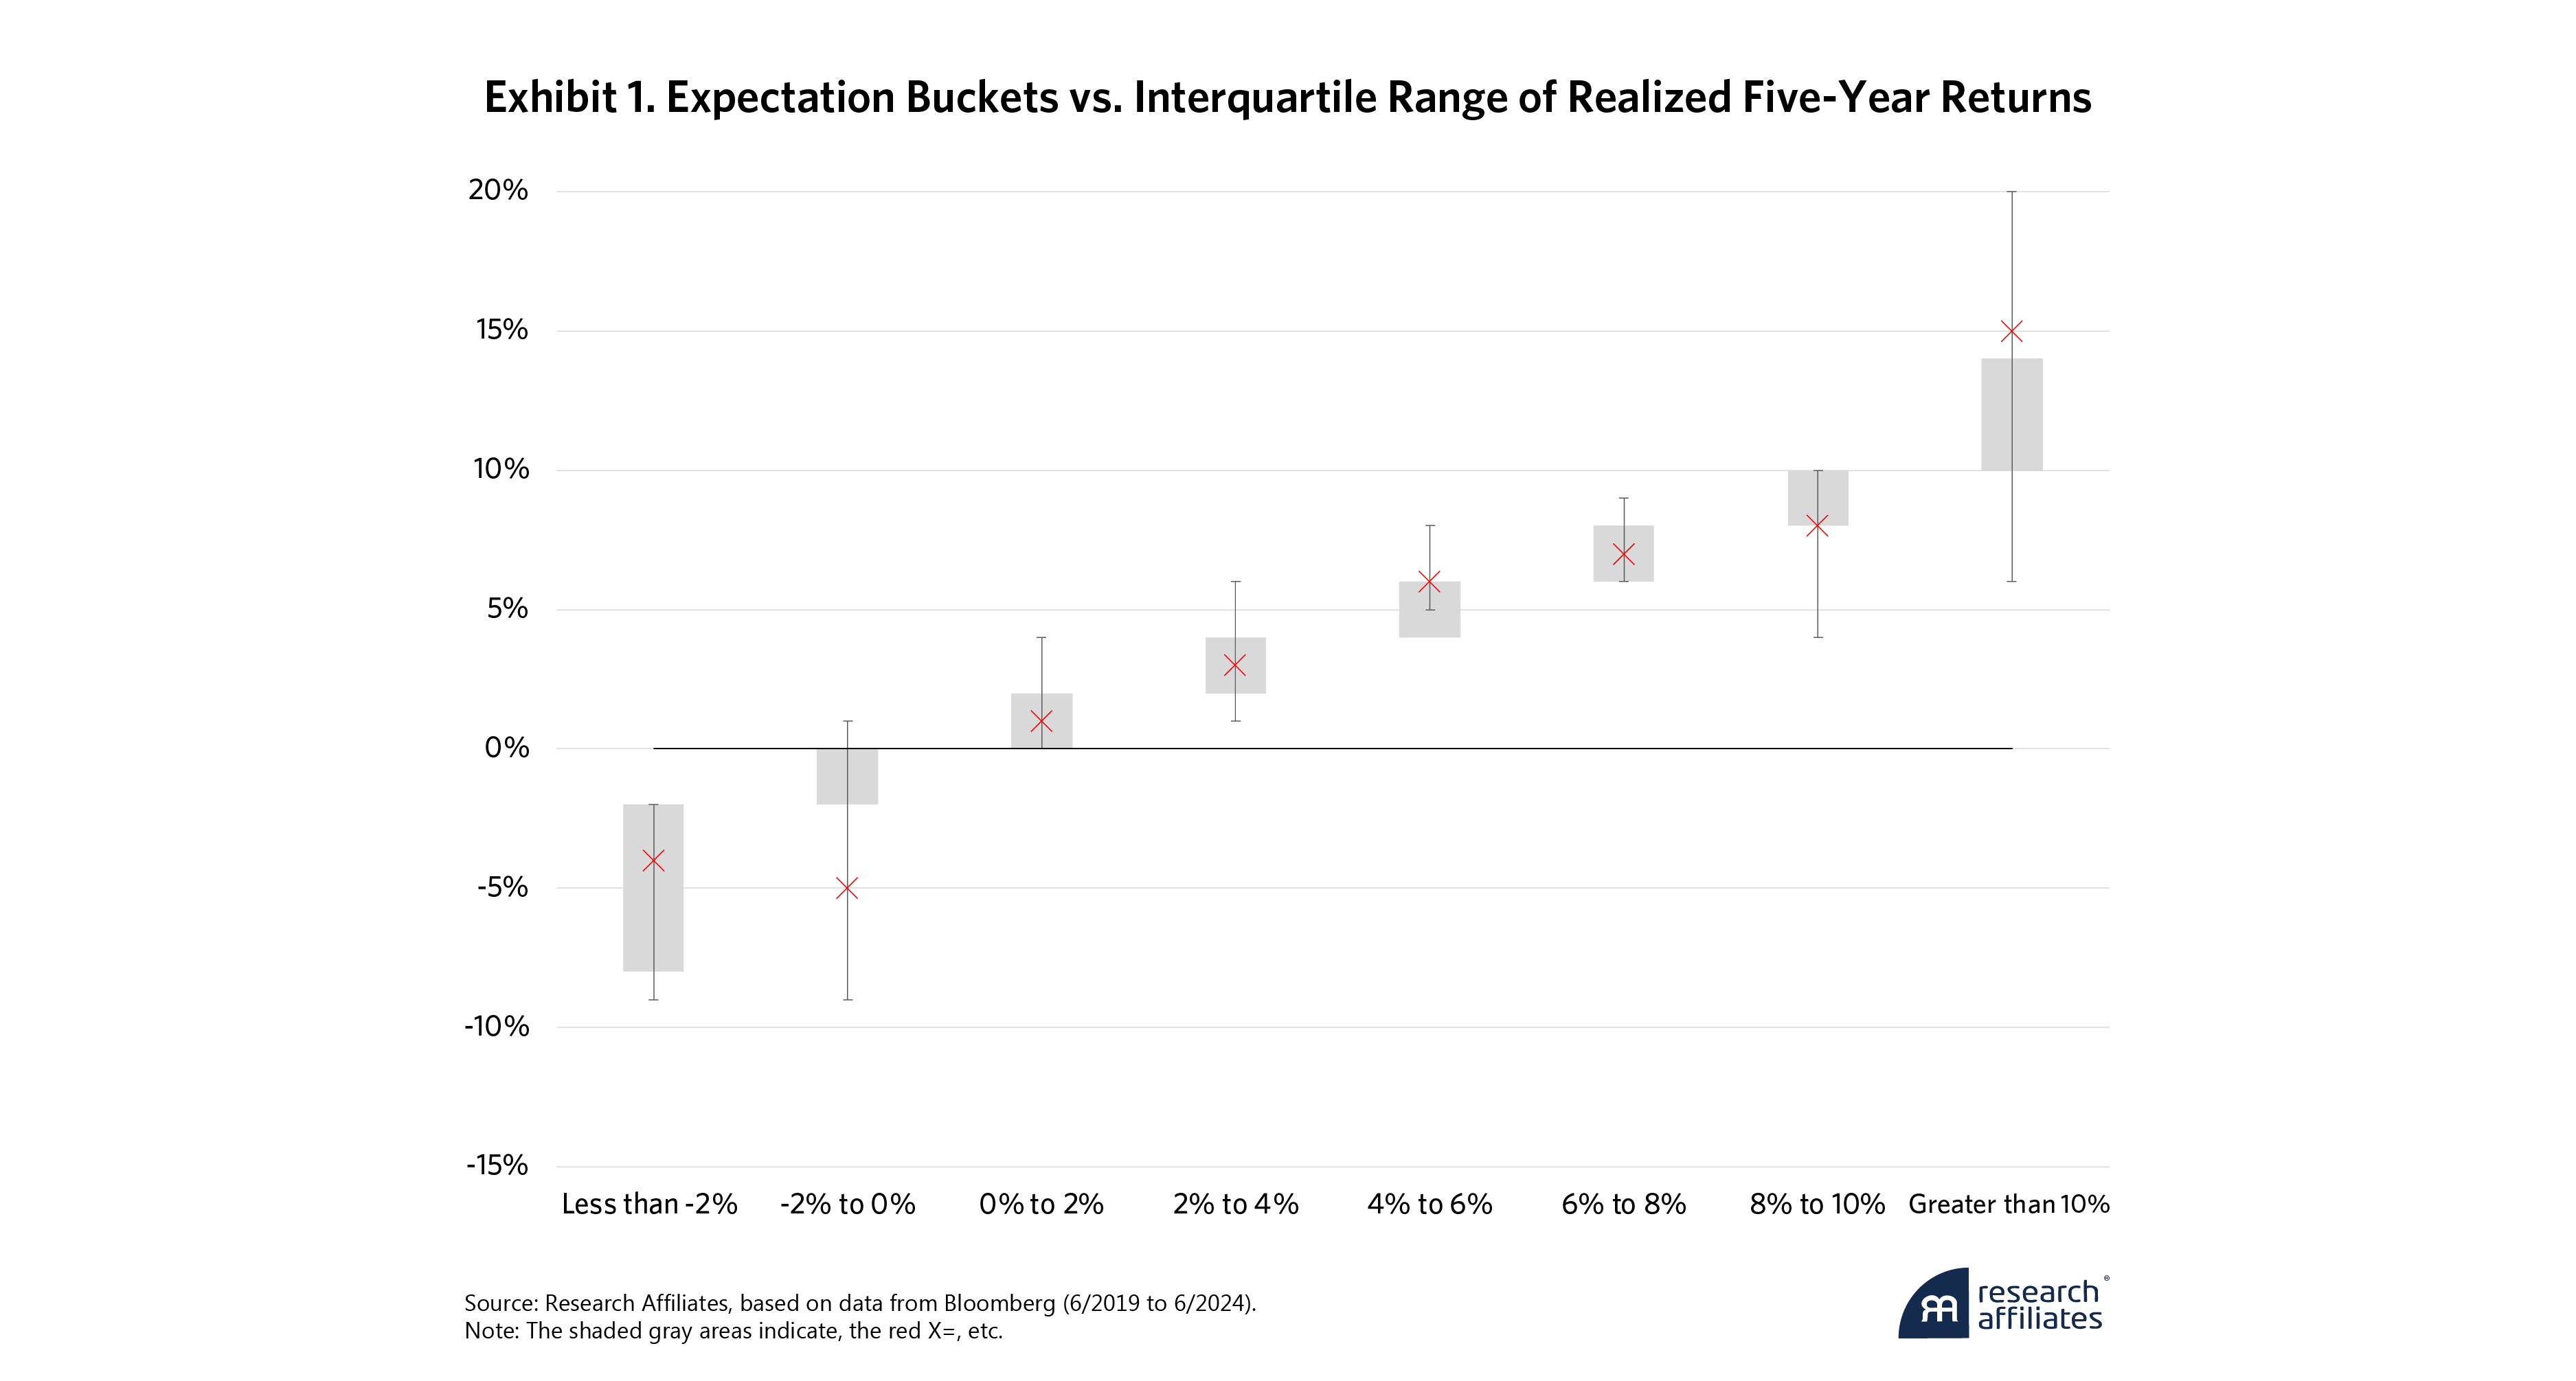
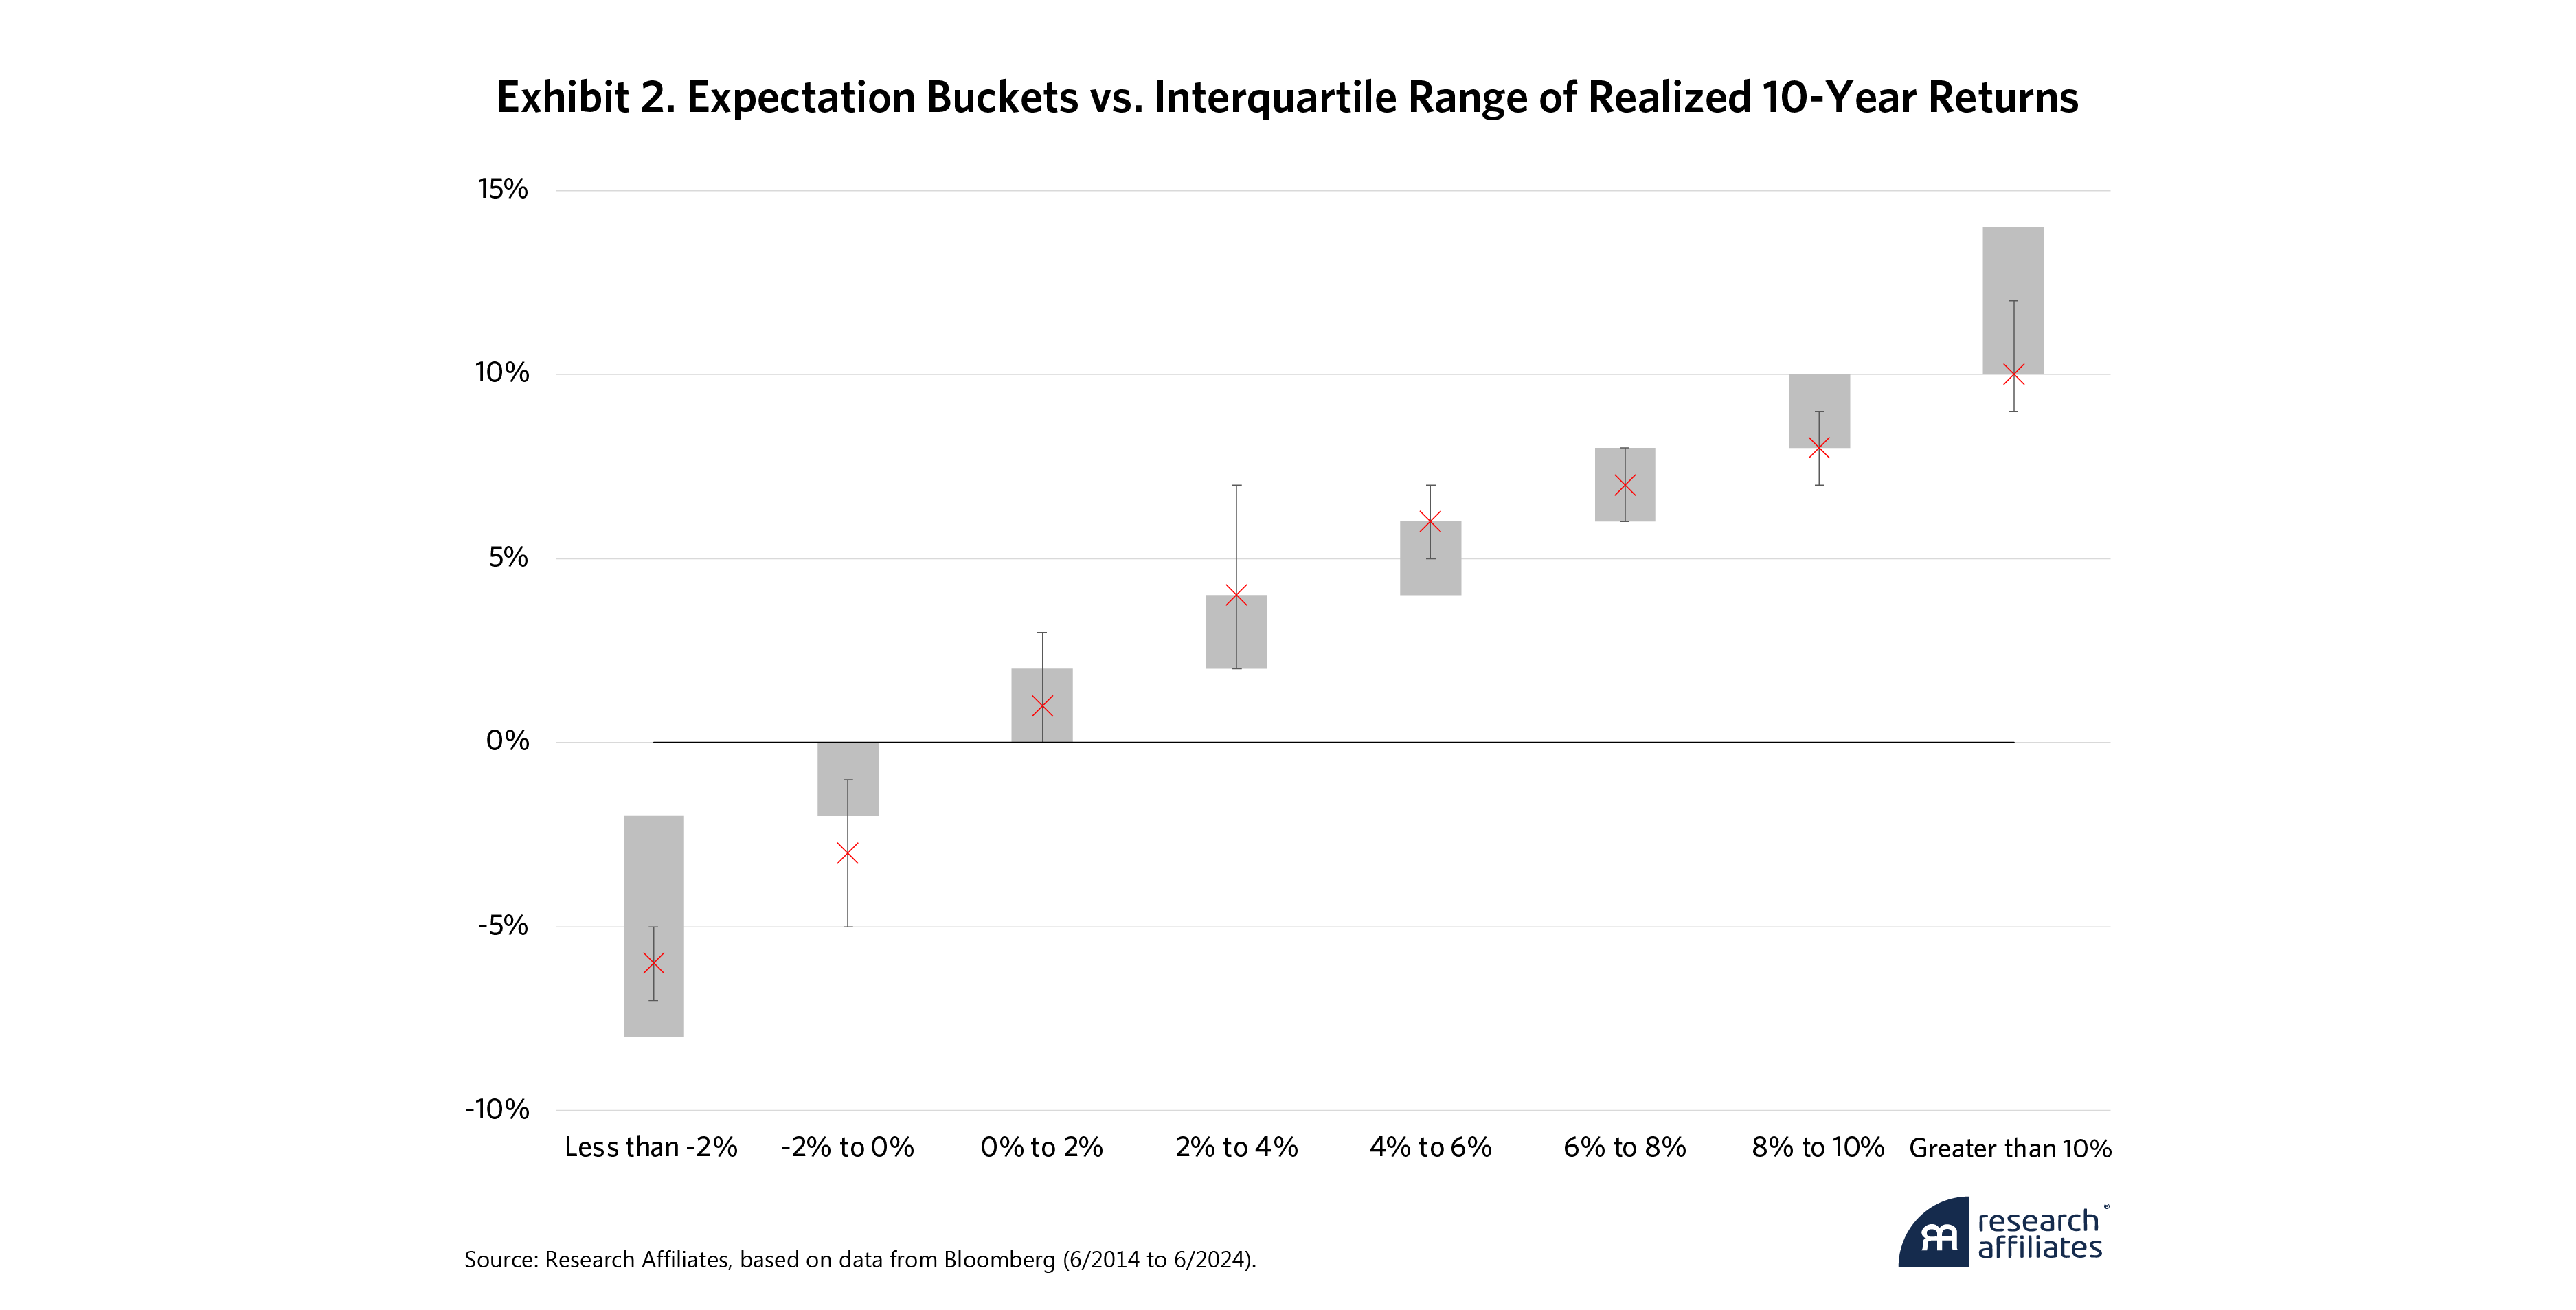
The Good: AAI’s CMEs of average returns largely fall in the middle of the distribution of realized returns over the past 30 years across both five- and 10-year time horizons.
The Not Too Bad: The rank order of AAI’s expectations has anticipated realized asset returns in the last 10 years, with just a few notable outliers in equity markets.
The Ugly: Forecasting is an art as well as a science, and AAI’s results highlight areas for future research, particularly in its currency expectations.
Introduction
Capital market expectations (CMEs) are a key input in the strategic asset allocation processes of asset owners of all sizes. Long ago, we recognized that many asset owners were ignoring current environment fundamentals and simply using historical average returns, or historical risk premia, to estimate the future return of the assets in their portfolios. Although unconditional views of history can help forecast across disciplines, strict assumptions about the nature of returns often don’t translate to financial data.
Create your free account or log in to keep reading.
Research Affiliates introduced its Asset Allocation Interactive (AAI) online tool 10 years ago to provide investors with CMEs that price assets based on their current fundamentals. AAI makes CMEs across a wide range of public asset markets publicly available in a timely manner free of charge and with a transparent methodology. Our CMEs are updated monthly and cover more than 140 assets converted into six global currencies.
This fall, AAI evolved beyond simple asset classes and introduced long-term CMEs for a set of systematic equity strategies. We plan to grow this list, both in equities and other asset classes, in the months ahead to give investors a view of return expectations above and beyond the standard market (beta) exposures for the strategies that make up their portfolios.
While an important milestone, AAI’s 10th birthday is not the main focus here. Rather, AAI’s launch in 2014 corresponded with the early stages of the phenomenal bull market in U.S. stocks and bonds that has led many to question the utility of fundamentally motivated CMEs. Addressing these doubts, through the prism of a variety of asset class CMEs, is the chief motivation of this analysis.
Setting Expectations
In mathematics, an expectation and an average are synonymous. After all, future expectations should be based on experience. This is why historical returns guide future return expectations. But Thomas Phillip’s Estimating Expected Returns: Then and Now ( Journal of Portfolio Management 2024) demonstrates historical averages are sound expectations only if there is a long history of data from which to estimate an unconditional average, and that average is constant over time. Financial data does not fit that bill. Take bonds, for instance. Their return is based largely on the coupons paid by the bond, or its yield. With rates near 5%, no one should expect a bond’s future return to reflect the historical average over periods when rates were 10% or higher. The same goes for all other assets.
That’s why AAI applies a bottom-up, three-component model to construct our CMEs. This approach improves out-of-sample forecasts by 30% compared to those derived from the historical average, according to Rui Ma and co-authors in Estimating Long-Term Expected Returns (Financial Analysts Journal 2024).
AAI applies a bottom-up, three-component model to construct our CMEs. This approach improves out-of-sample forecasts by 30% compared to those derived from the historical average.
”Data
To assess AAI’s performance, this review develops a cross-sectional perspective using a set of 18 assets, across nine asset classes. We look beyond U.S. stocks and bonds because most investors have looked beyond them in their strategic asset allocation.
| Asset Class | Asset |
|---|---|
| U.S. Equity | U.S. Large Cap |
| U.S. Equity | U.S. Small Cap |
| International Equity | Developed Market |
| EM Equity | Emerging Markets |
| U.S. Bonds | Short-Term Treasury |
| U.S. Bonds | Intermediate Treasury |
| U.S. Bonds | Long-Term Treasury |
| U.S. Bonds | Aggregate Bonds |
| Credit | U.S. Intermediate Corporates |
| Credit | U.S. Long Corporates |
| Credit | U.S. High Yield |
| Credit | EM Hard Currency Sovereign |
| International Bonds | Global Treasury |
| International Bonds | EM Local Sovereign |
| TIPS | Intermediate TIPS |
| TIPS | Long TIPS |
| REITs | Equity REITs |
| Commodities | Diversified Commodities |
To better understand how the model would fare historically without oversaturating the results with “expectations” that predate AAI’s existence, we only examine expectations starting from 1990. This way we capture the dot-com bubble of the 1990s, when tech company valuations were soaring much like they are today. This yields a small but compelling sample of seven non-overlapping five-year periods and 3.5 non-overlapping decades.
The Good: Expectations by Return Cohort
AAI’s CMEs are designed for long-term strategic asset allocation. We define “long-term” as a 10-year period, but since many clients approach strategic planning in five-year windows, we look at results over both time frames, with the most recent five- and 10-year samples commencing in June 2019 and 2014, respectively.
Expectations are designed to anticipate the central tendency of asset returns with the understanding that asset volatility makes outliers inevitable. First, we take the expectations across each of the 18 asset classes, each month over the entire horizon grouped into 2% buckets—2% to 4%, 4% to 6%, etc. We then measure each asset’s realized return, so each expectation bucket has a distribution of realized returns for those assets. Exhibit 1 and Exhibit 2 show that, by and large, AAI’s expectations closely matched the mean realized returns of the assets in each bucket. The interquartile range (25% to 75%) of realized returns also reflected expectations.
Below-zero expectations, specifically those in the -2% to 0% range, were the exception over both the five- and 10-year horizons. AAI’s CMEs in these ranges, which occur only about 2% of the time in this sample, tended to be more optimistic than the average realized return.
Anyone that compares Research Affiliates’ Capital Market Expectations to CMEs from other providers will assuredly have noticed that our expectations are often lower in magnitude. This was also noted in Magnus Dahlquist and Markus Ibert’s Institutions' Return Expectations across Assets and Time (2024), a study across a large panel of CMEs from asset managers, investment consultants and wealth advisors. Although lower, it doesn’t appear to impact the relationship to the bulk of subsequent realized returns.
Expectations by Asset Class
Developed market sovereign bonds have been default-free over recent history and are the most straightforward assets to price since future returns closely match starting yields. In fact, starting yield is the best predictor of returns at a horizon equal to twice the duration of the bond plus one year, according to Martin Leibowitz and Sidney Homer’s Inside the Yield Book (2013). This means, for a 10-year horizon, the magic duration is 4.5 years, or just about the duration of many commonly held bond portfolios. Since AAI does not price individual bonds but bond indices, or collections of bonds that go in and out of the index, and the durations are not all set to five years, the fit won’t be exact. Nevertheless, Exhibit 3 shows that the model performed quite well for U.S. bonds over the 10-year horizon, with a beta of 1, an intercept of 42 basis points (bps), and an R2 of 75%.1 Our expectations had a 1-to-1 relationship with realized returns and were only off by 42 bps.
While Treasury Inflation-Protected Securities (TIPS) and international bonds are also high-quality sovereign bonds, the model’s beta for the 10-year time frame moved away from 1 and its R2 fit fell. Since TIPS include the return of traditional Treasuries plus realized changes in the Consumer Price Index (CPI), this indicates AAI’s long-term inflation expectations have undershot realized inflation over the sample.
Pricing developed market international bonds follows the same process as U.S. bonds, but the need to forecast currency return introduces an additional layer of complexity. The significant drop-off in fit measure compared to U.S. bonds and TIPS suggests the currency models lack predictability. Since long-term currency returns are a combination of inflation differentials across countries, along with mean reversion in real foreign exchange rates, global inflation expectations are impacting the fit for global bonds just as they did for TIPS.
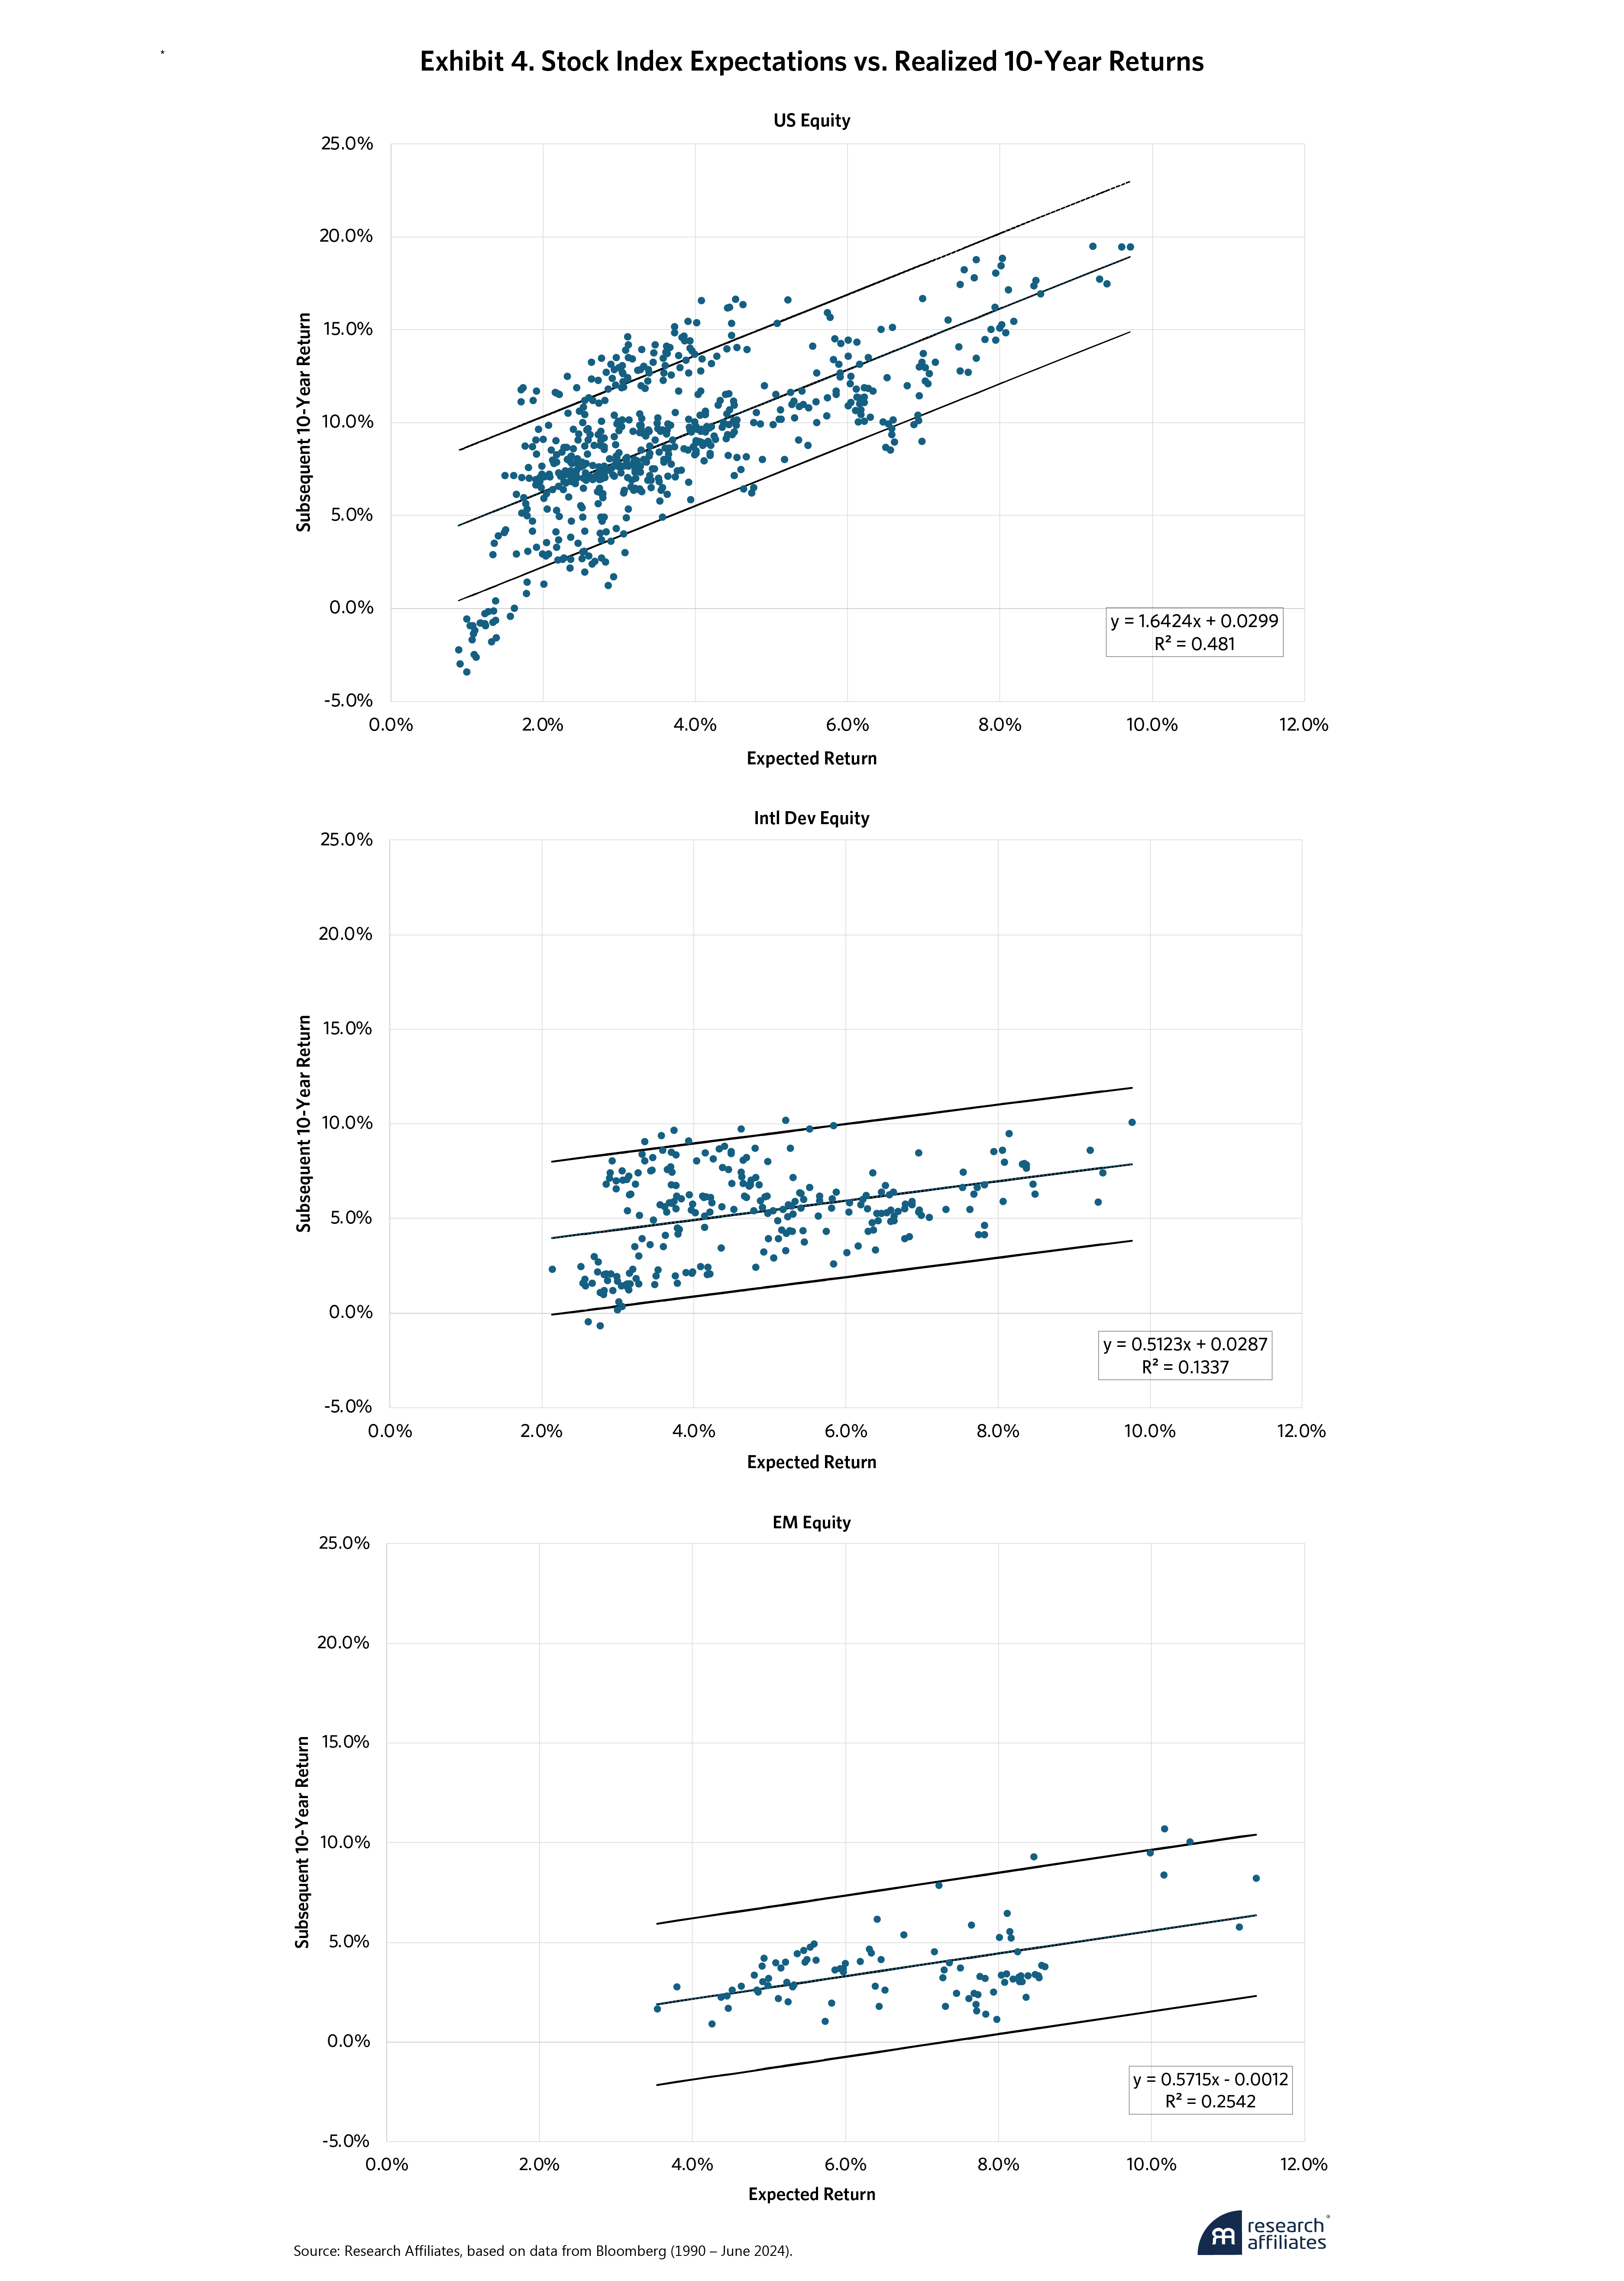
AAI’s CMEs across U.S., international, and emerging markets equities exhibit a positive relationship to realized returns. Exhibit 4 shows our expectations have been on the low side for U.S. equities during the past 35 years, with a beta of 1.6 and an intercept of 3%, and on the high side for their international and emerging market counterparts, with betas between 0.5 and 0.6, albeit with positive intercepts.
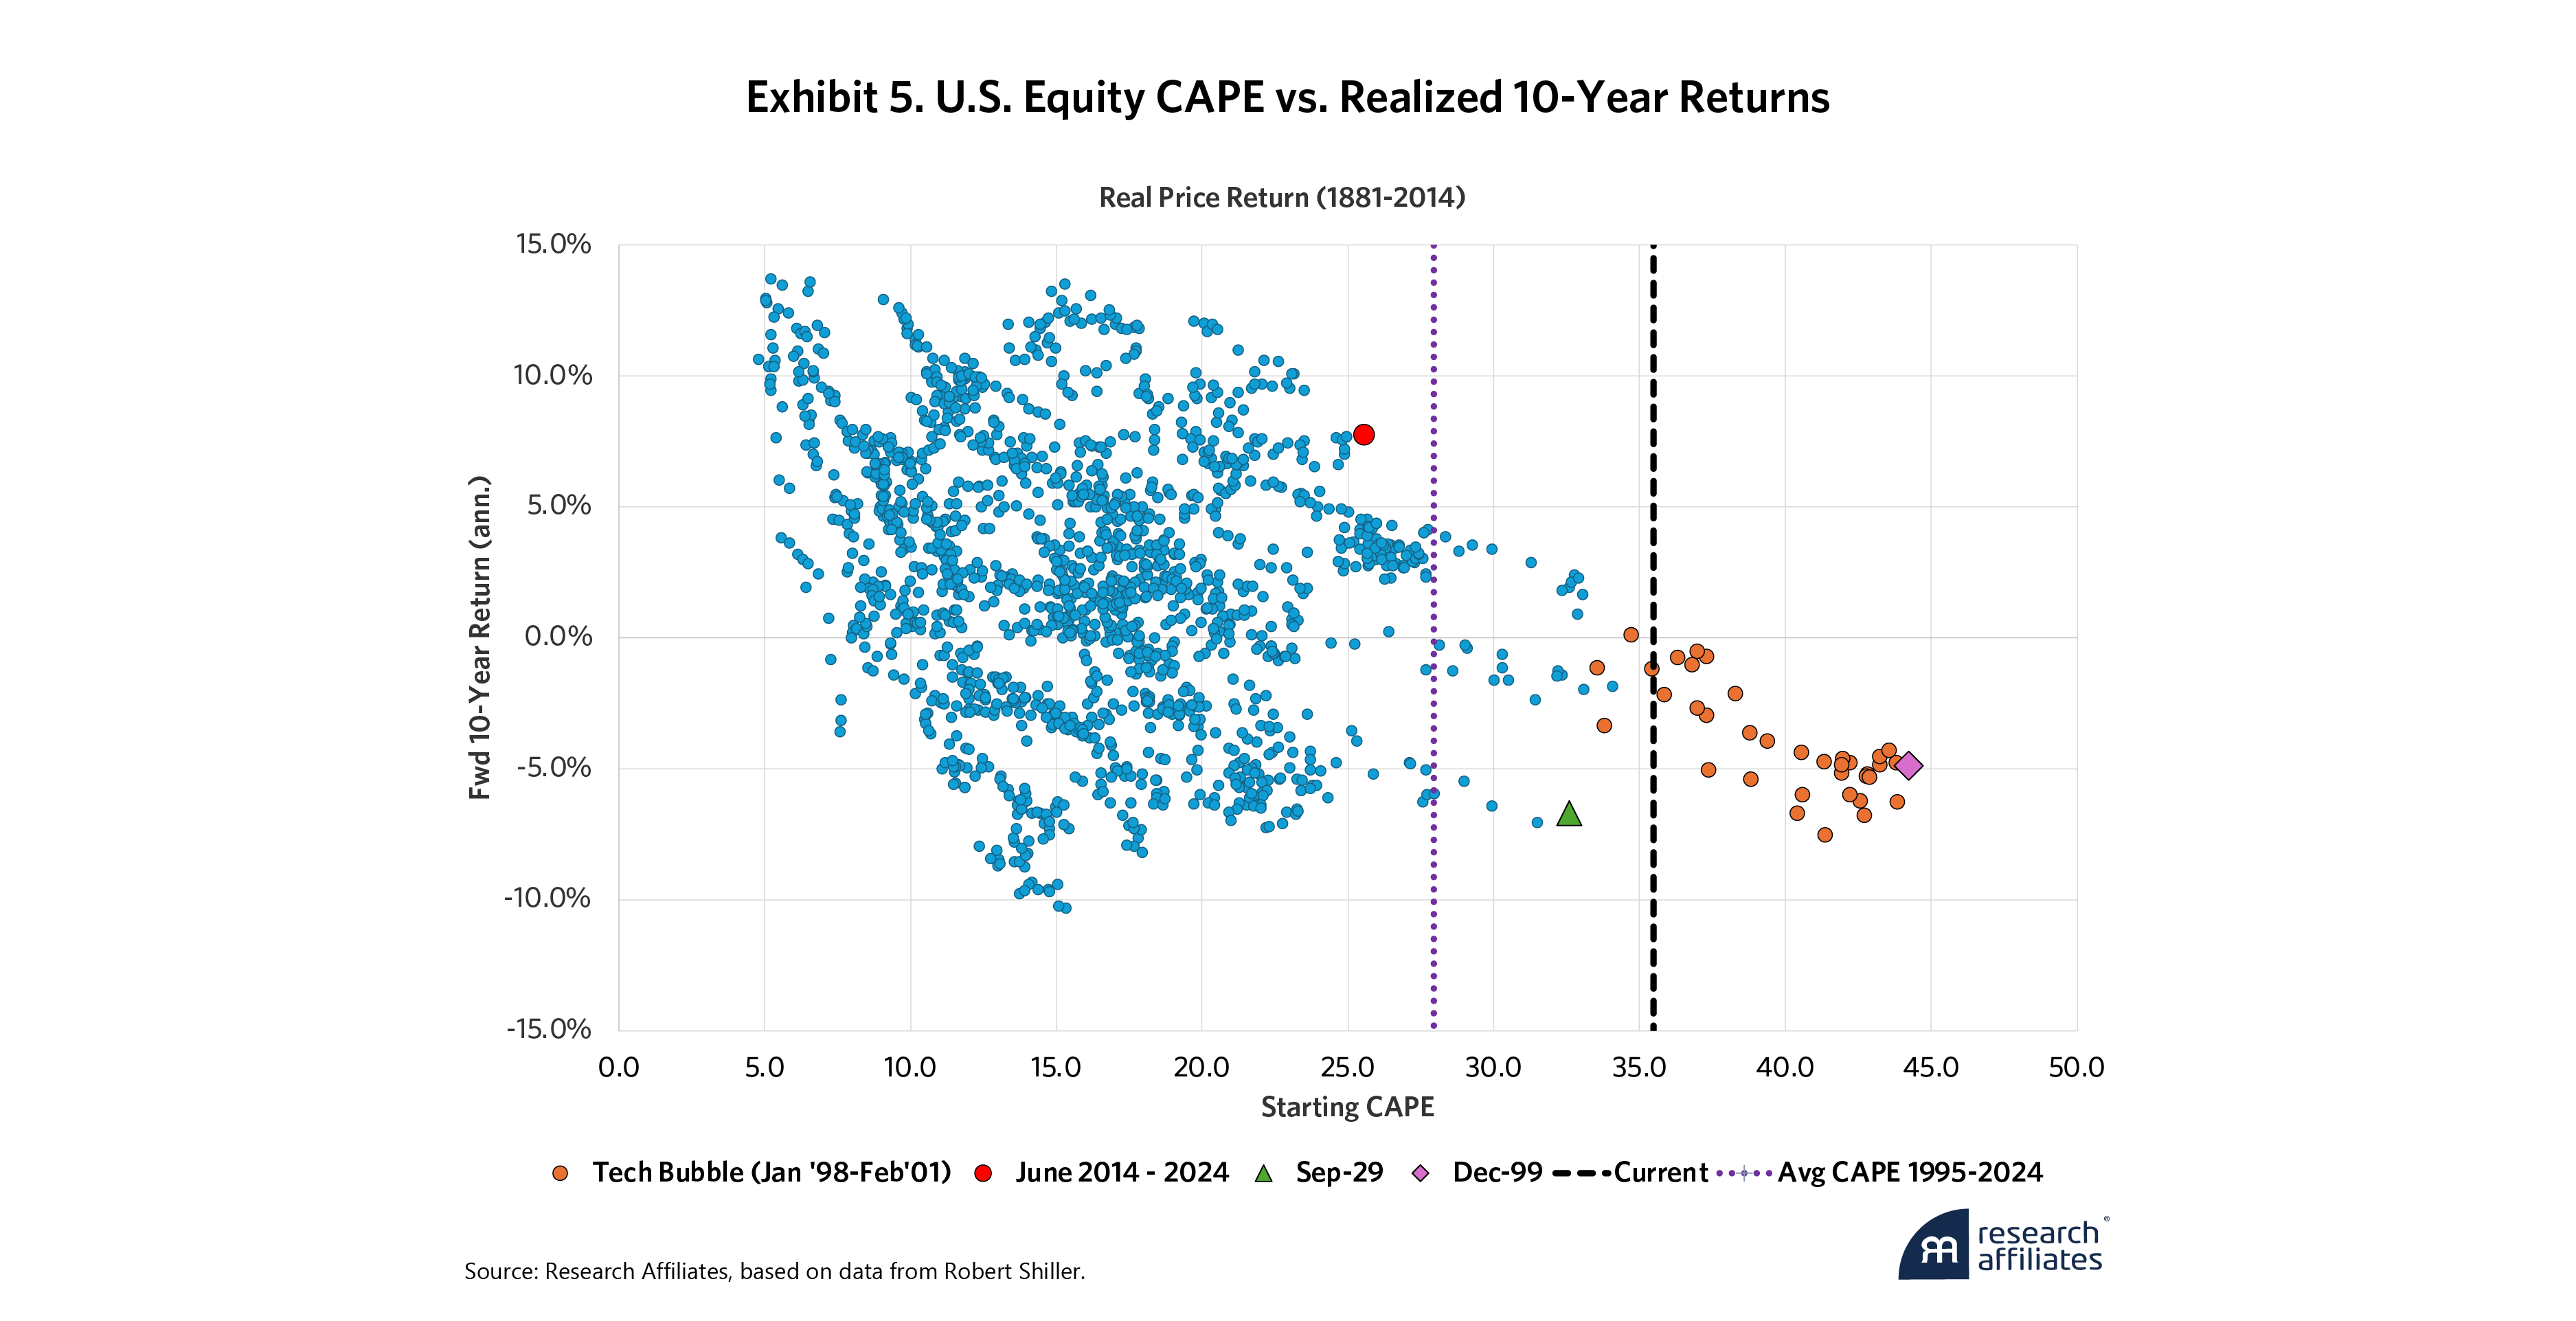
What explains our under expectation for U.S. equities? Exhibit 5 shows elevated CAPE ratios are a prime culprit. With the highest starting CAPE level and the highest subsequent return combination in history, the last decade has been an extreme outlier. In fact, the 3% intercept is directly related to the upward revaluation, the increasing P/E multiples, of U.S. equities. This contributed 3.4% per year to total return. That trend is unlikely to continue.
AAI’s CMEs across U.S., international, and emerging markets equities exhibit a positive relationship to realized returns.
”This does not mean the U.S. CAPE will revert to its historical average of 17. But if the current CAPE of around 35 reverts only to 28, its average since the start of the Internet Age in 1995, it would indicate either a 20% appreciation of 10-year earnings, a 20% price depreciation, or some other commensurate combination of earnings appreciation and price depreciation.
AAI applies the same pricing method for U.S. and international equities. We start with the dividends paid to investors and then estimate earnings per share growth and mean reversion in equity multiples. The lack of mean reversion during the latest bull market, along with currency expectations, affects the fit across these markets.
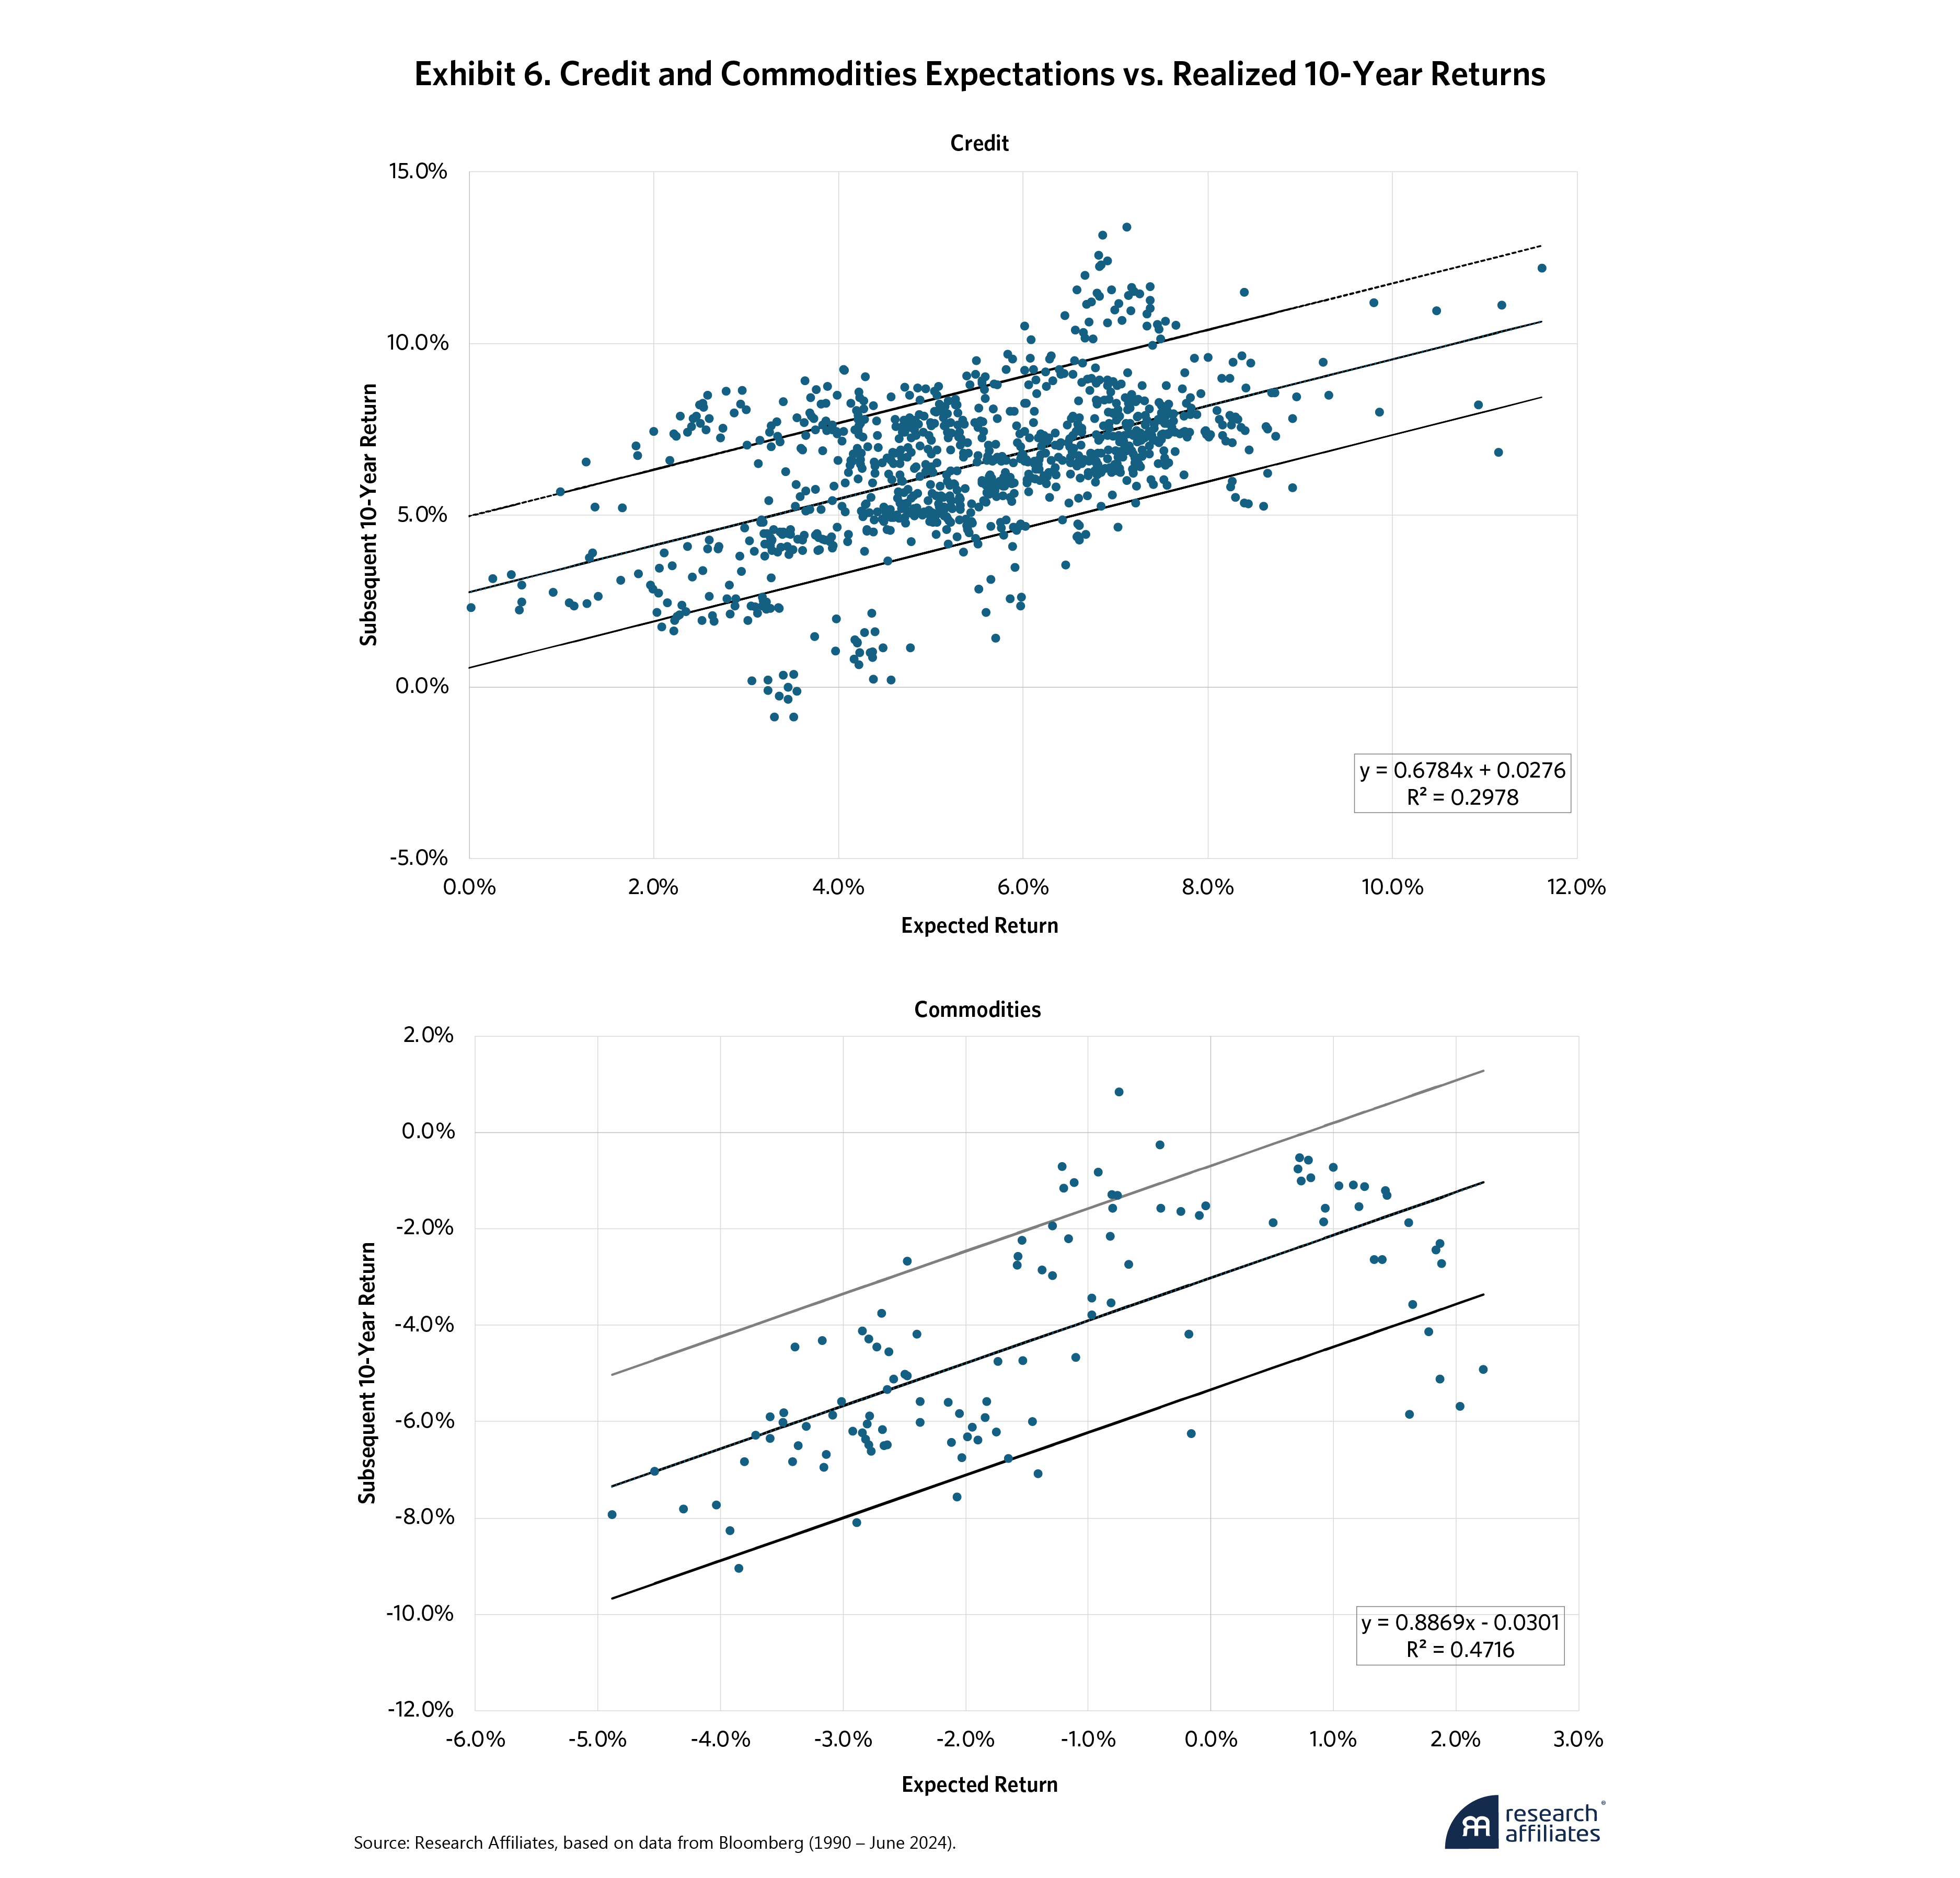
For credit bonds, AAI builds on government bond models to include both spread and downgrade and default expectations. This contributed to a wider dispersion in returns around crisis periods.
Commodities, specifically commodity futures rather than spot commodities, are short-term instruments that must be repeatedly rolled over the 10-year horizon. AAI’s commodities expectations tended to be too optimistic, anticipating upward mean appreciation that didn’t materialize over this sample.
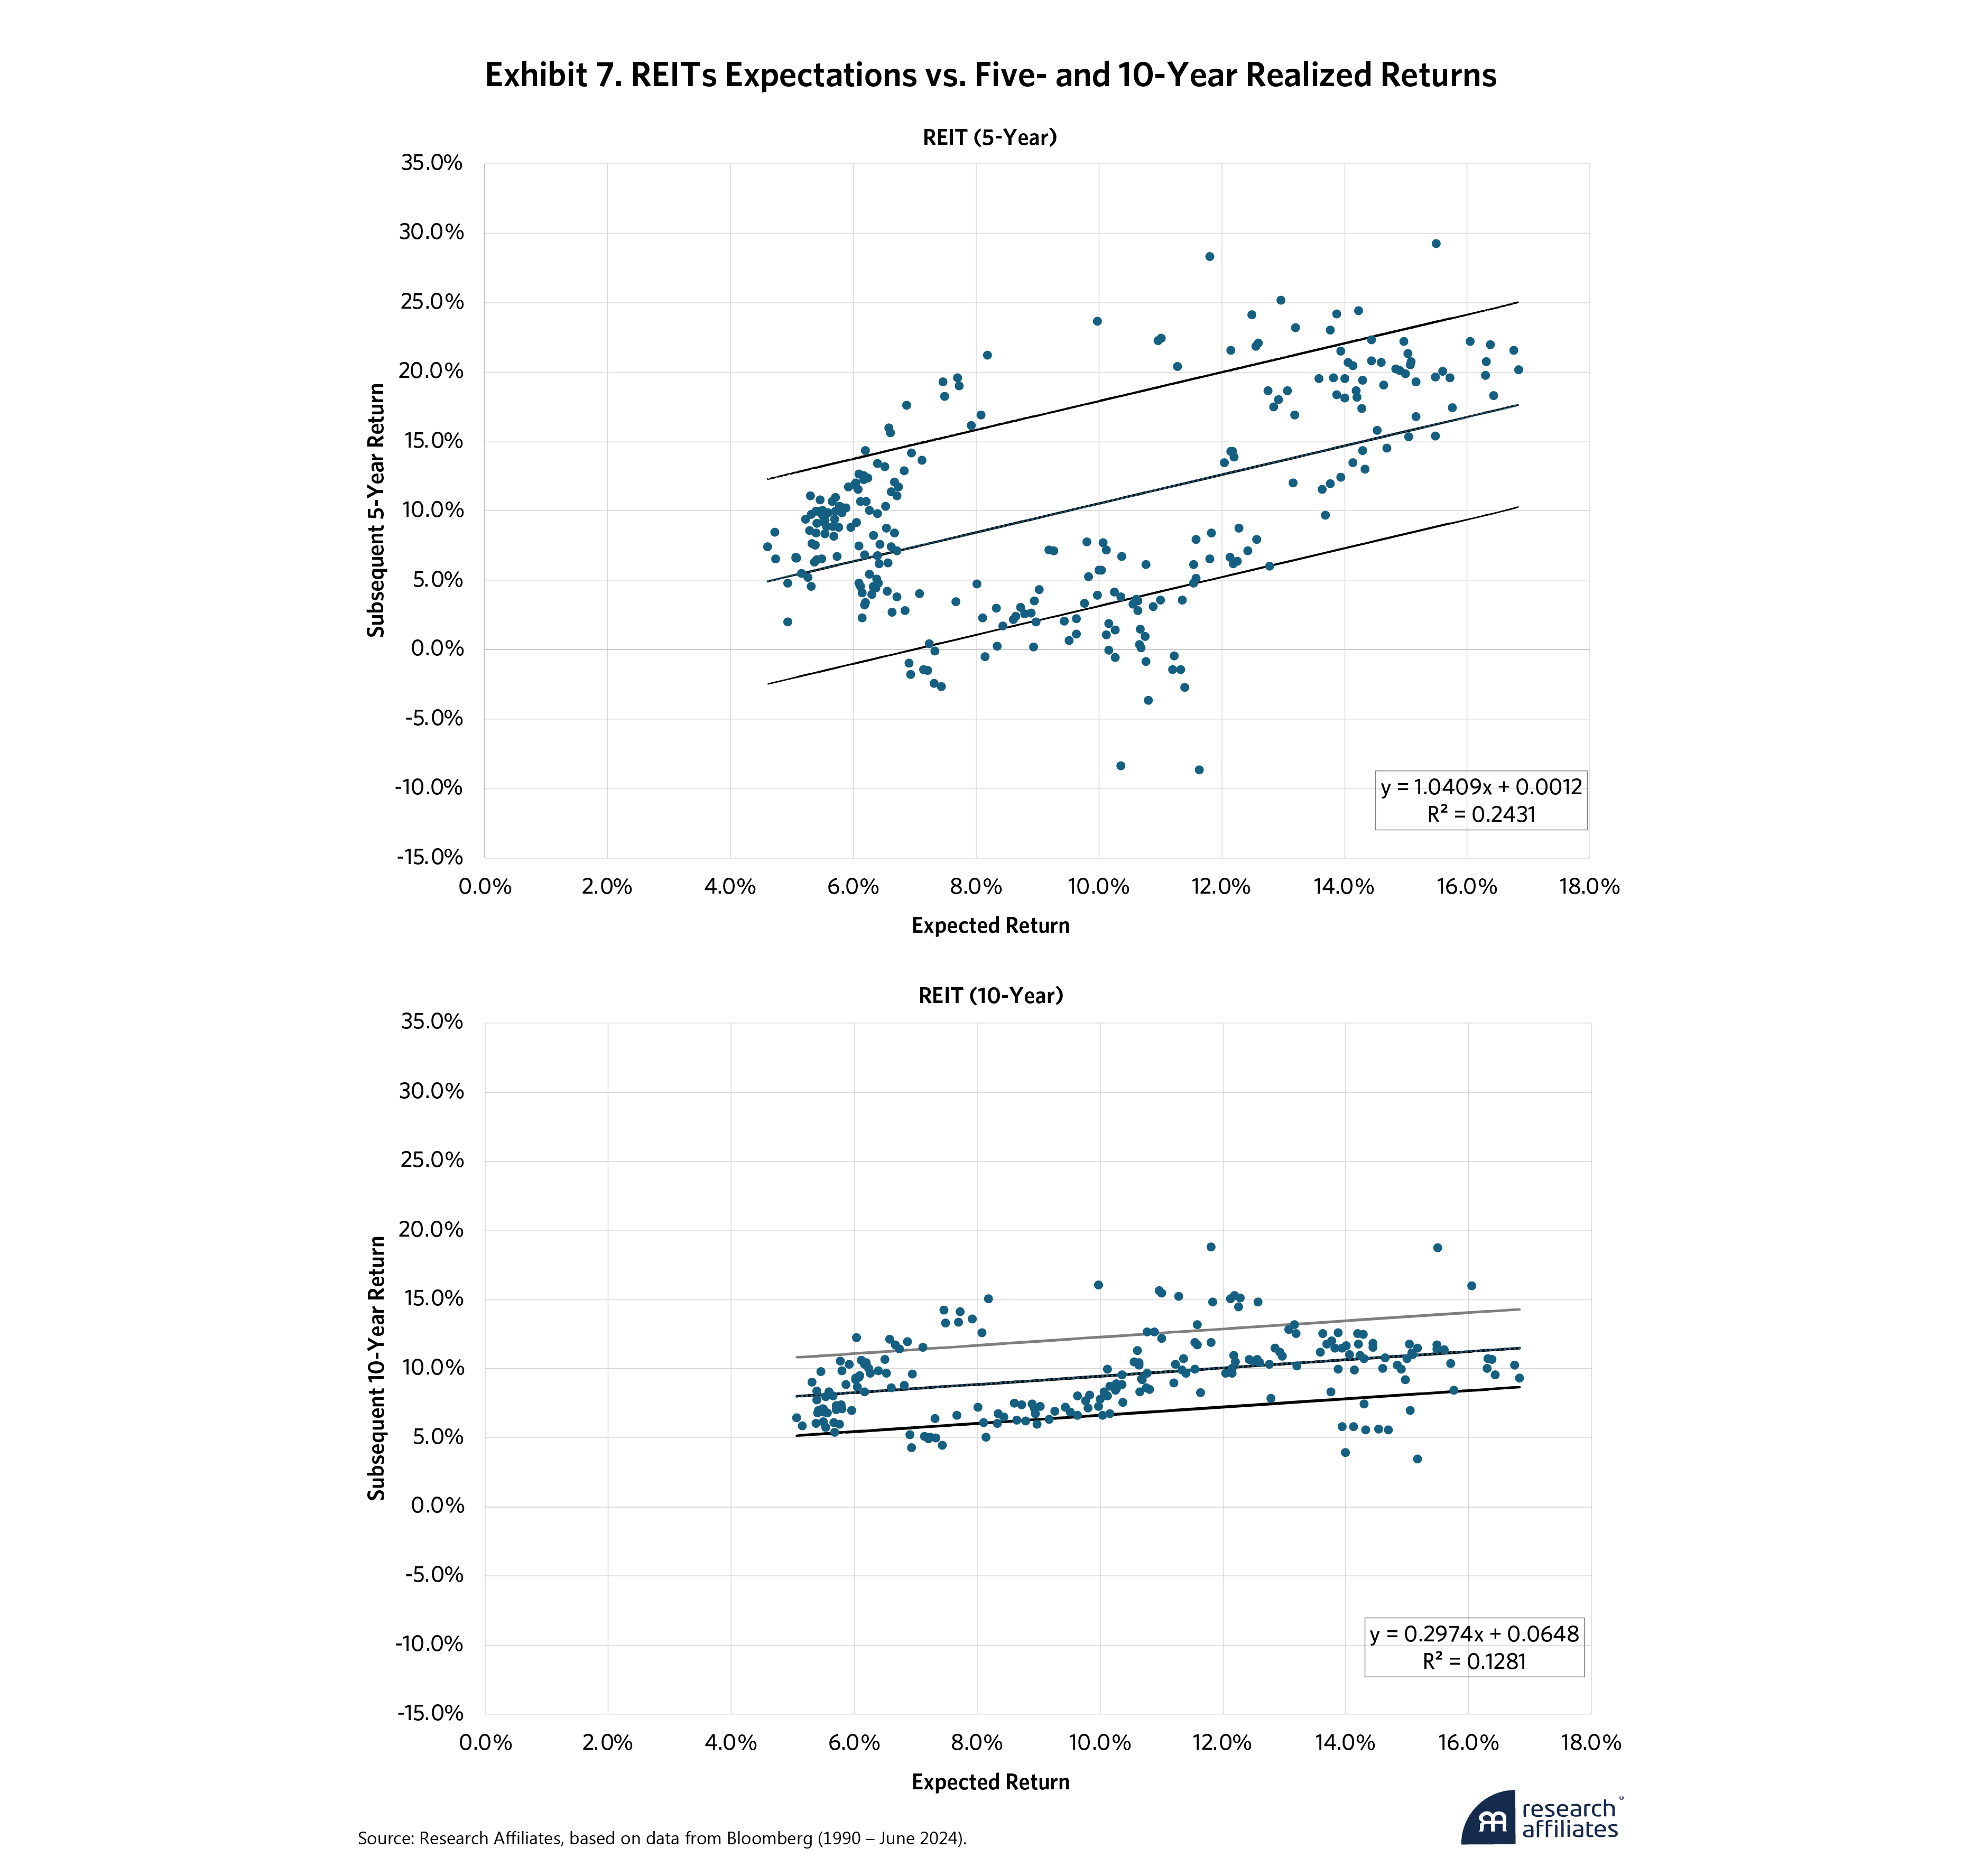
For real estate investment trusts (REITs), Exhibit 7 shows the fit of AAI’s model is quite good over five-year periods but not as good over 10-year intervals. Notwithstanding the short sample size, this suggests that AAI’s target fair valuation for REITs, a combination of real rates, BBB spreads, equity spreads, and the speed of mean reversion, may need future calibration to a 10-year horizon. The transformation of the REITs universe in recent years, with allocations to data centers, wireless towers, and other new segments, could complicate this. Mean reversion in these new tech-focused sectors is likely to be faster than in their traditional housing, office, and retail counterparts.
The Not Too Bad: Most Recent Ranks
For better or worse, we live in a “What have you done for me lately?” world. This begs the question: How have AAI’s CMEs performed over the last decade? Admittedly, it has been a challenging period. The bull market in stocks ignored valuations while depressed bond yields eclipsed the zero lower bound in many countries, and then global inflation surged to levels not seen in 40 years.
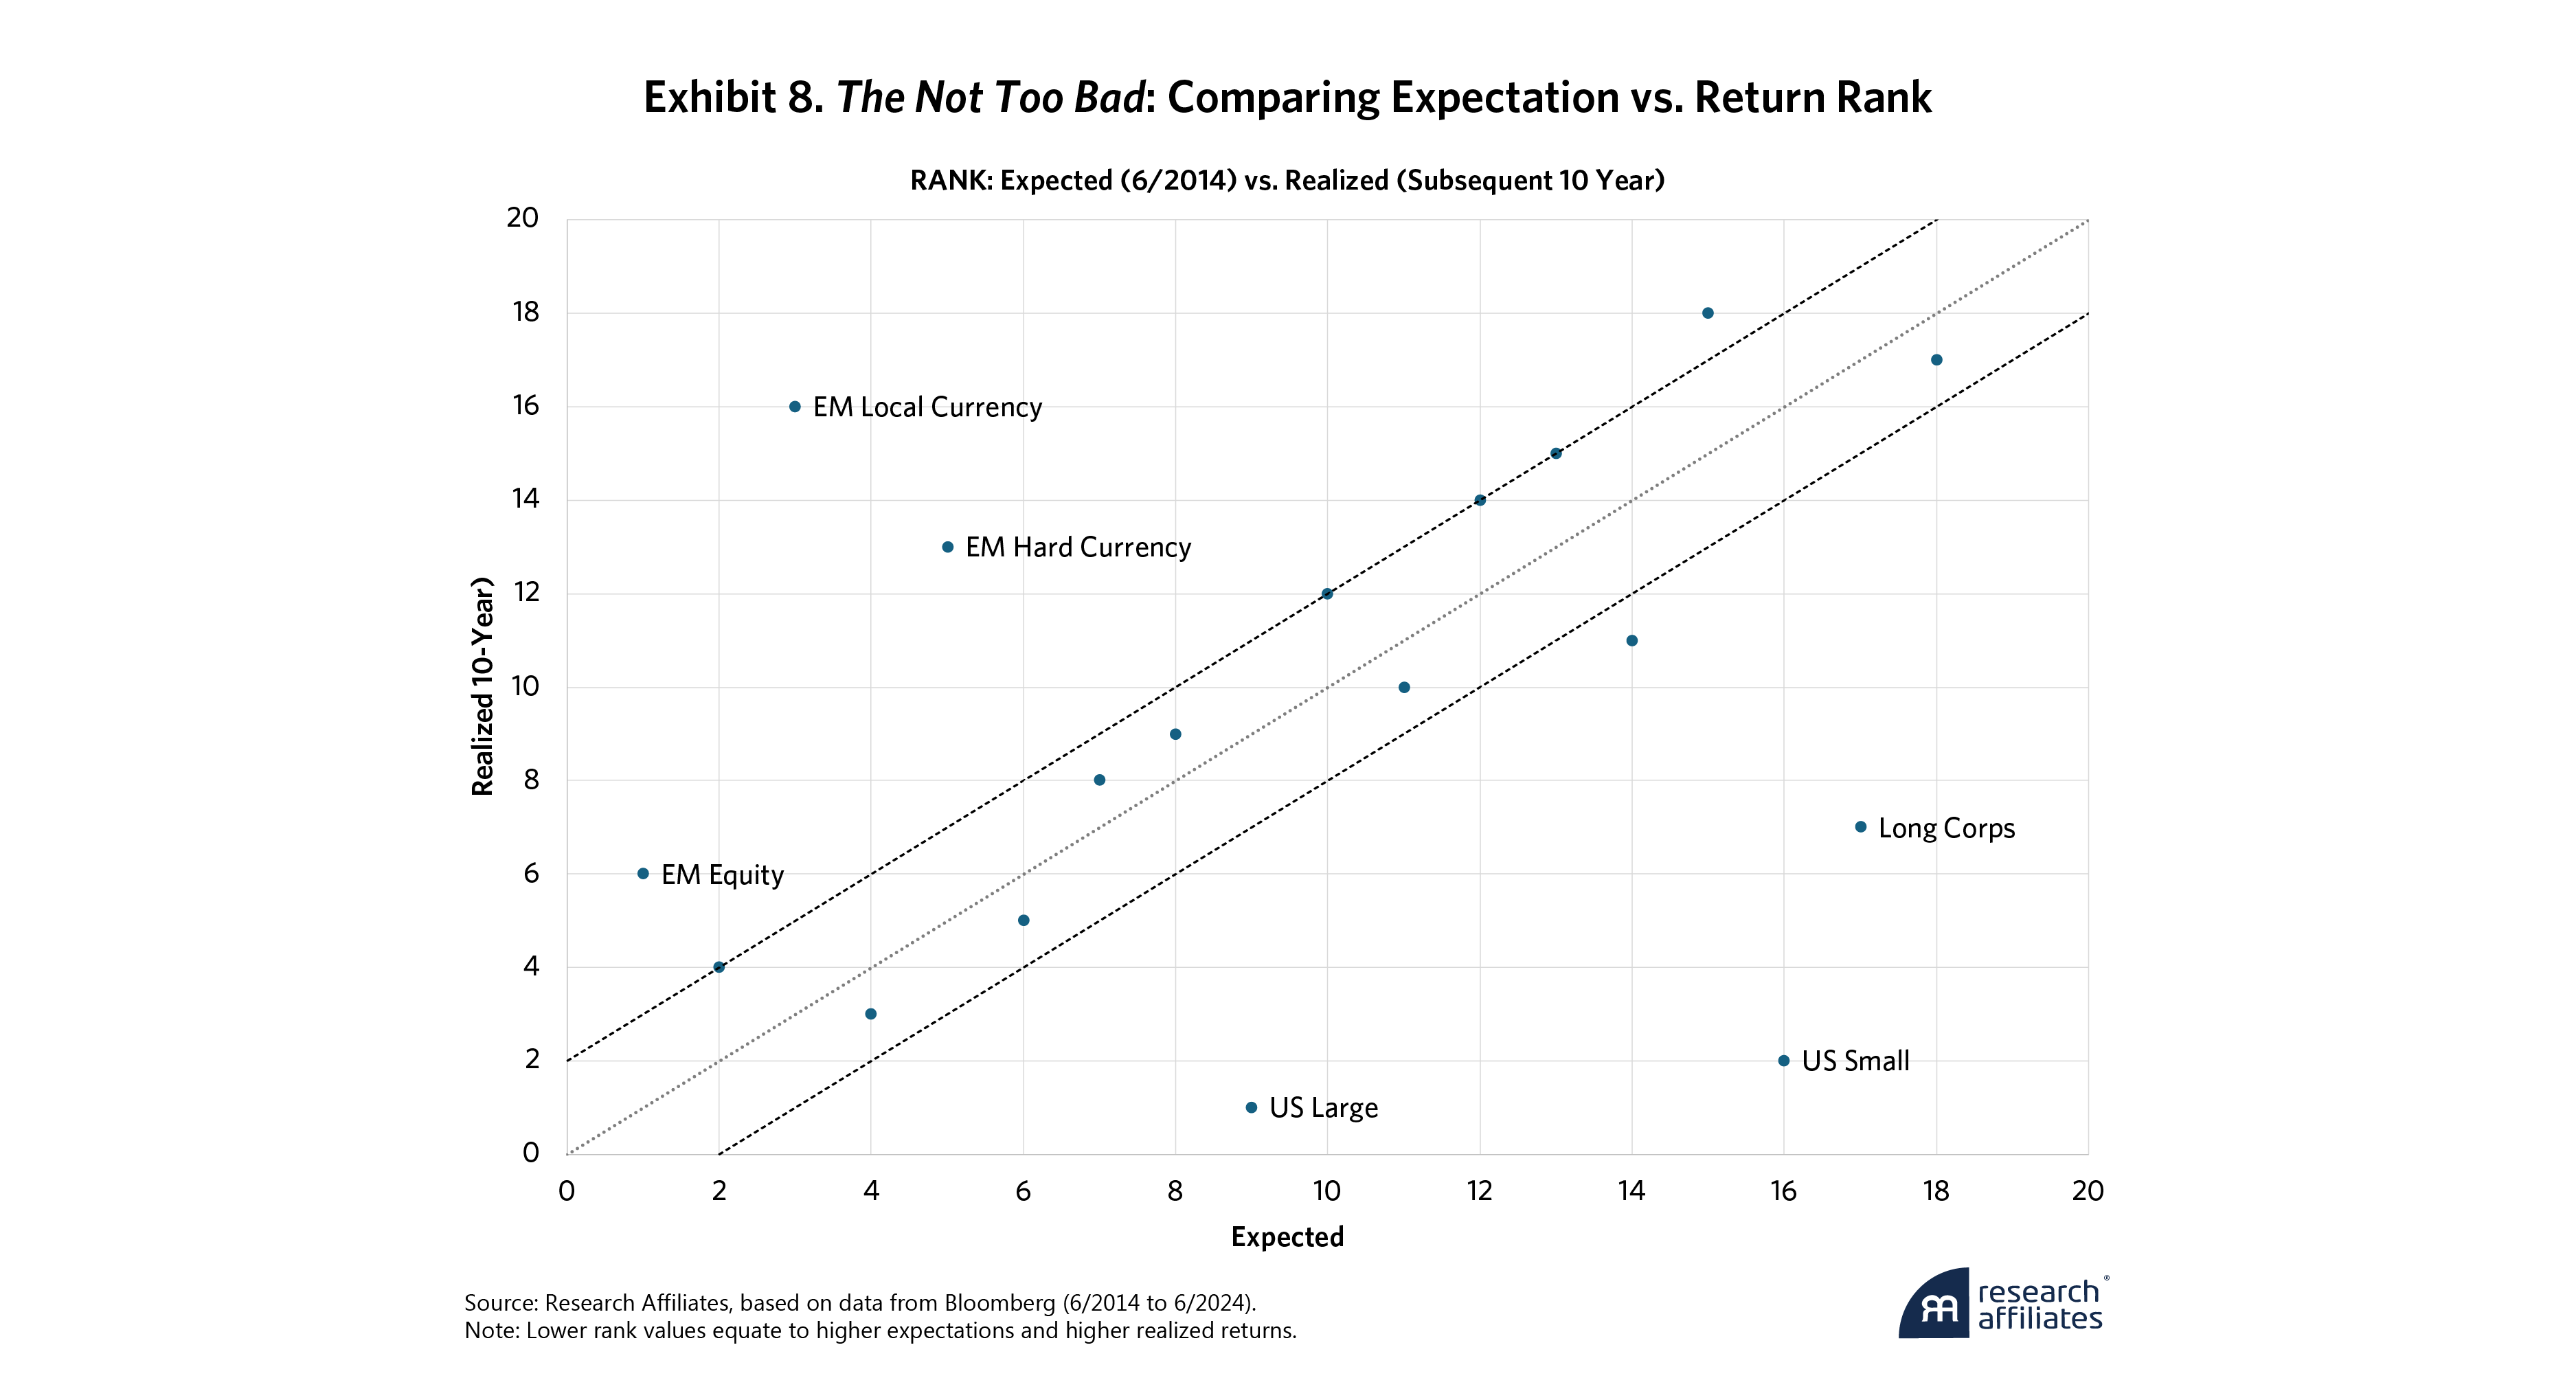
Even in that difficult environment, AAI’s CMEs fall comfortably in the “Not Too bad” category. Our goal with expected returns is always to build a decent portfolio. For that, the rank order of our expectations by asset should match that of their future returns. Obviously, the ideal is for the absolute value of our expectations to match future returns. But failing that, getting the rank order right means that portfolio allocations will be directionally correct.
With that in mind, we ranked the 18 assets by our return expectation in 2014 and by their realized return during the last 10 years to see how our model fared. For 12 of the 18 assets, the ranking difference between our expectations and realized returns was +/– 2. Given how far the U.S. equity bull market diverged from fundamentals, AAI’s CMEs underestimated U.S. stock and long corporate bond returns and overestimated their emerging market peers.
U.S. large caps were the top-performing asset in the last 10 years. Our expectations had them coming in ninth, right in the middle of the pack. On the flip side, according to our CMEs, EM equity should have led the pack but ended up ranked sixth.
Two-thirds of the assets, including many of those with the highest returns, came in close together, so this result qualifies as “not too bad.” But it isn’t good because AAI’s U.S. and EM rankings were so far off the mark. A portfolio constructed based on our expectations would have overweighted EM assets and underweighted U.S. stocks and bonds.
For investors with a core U.S. equity position that used CMEs to develop their diversification portfolio, U.S. stock expectations were less relevant, and AAI’s models, even more impactful to their asset allocation.
The Not Too Bad: Deviation from Realized
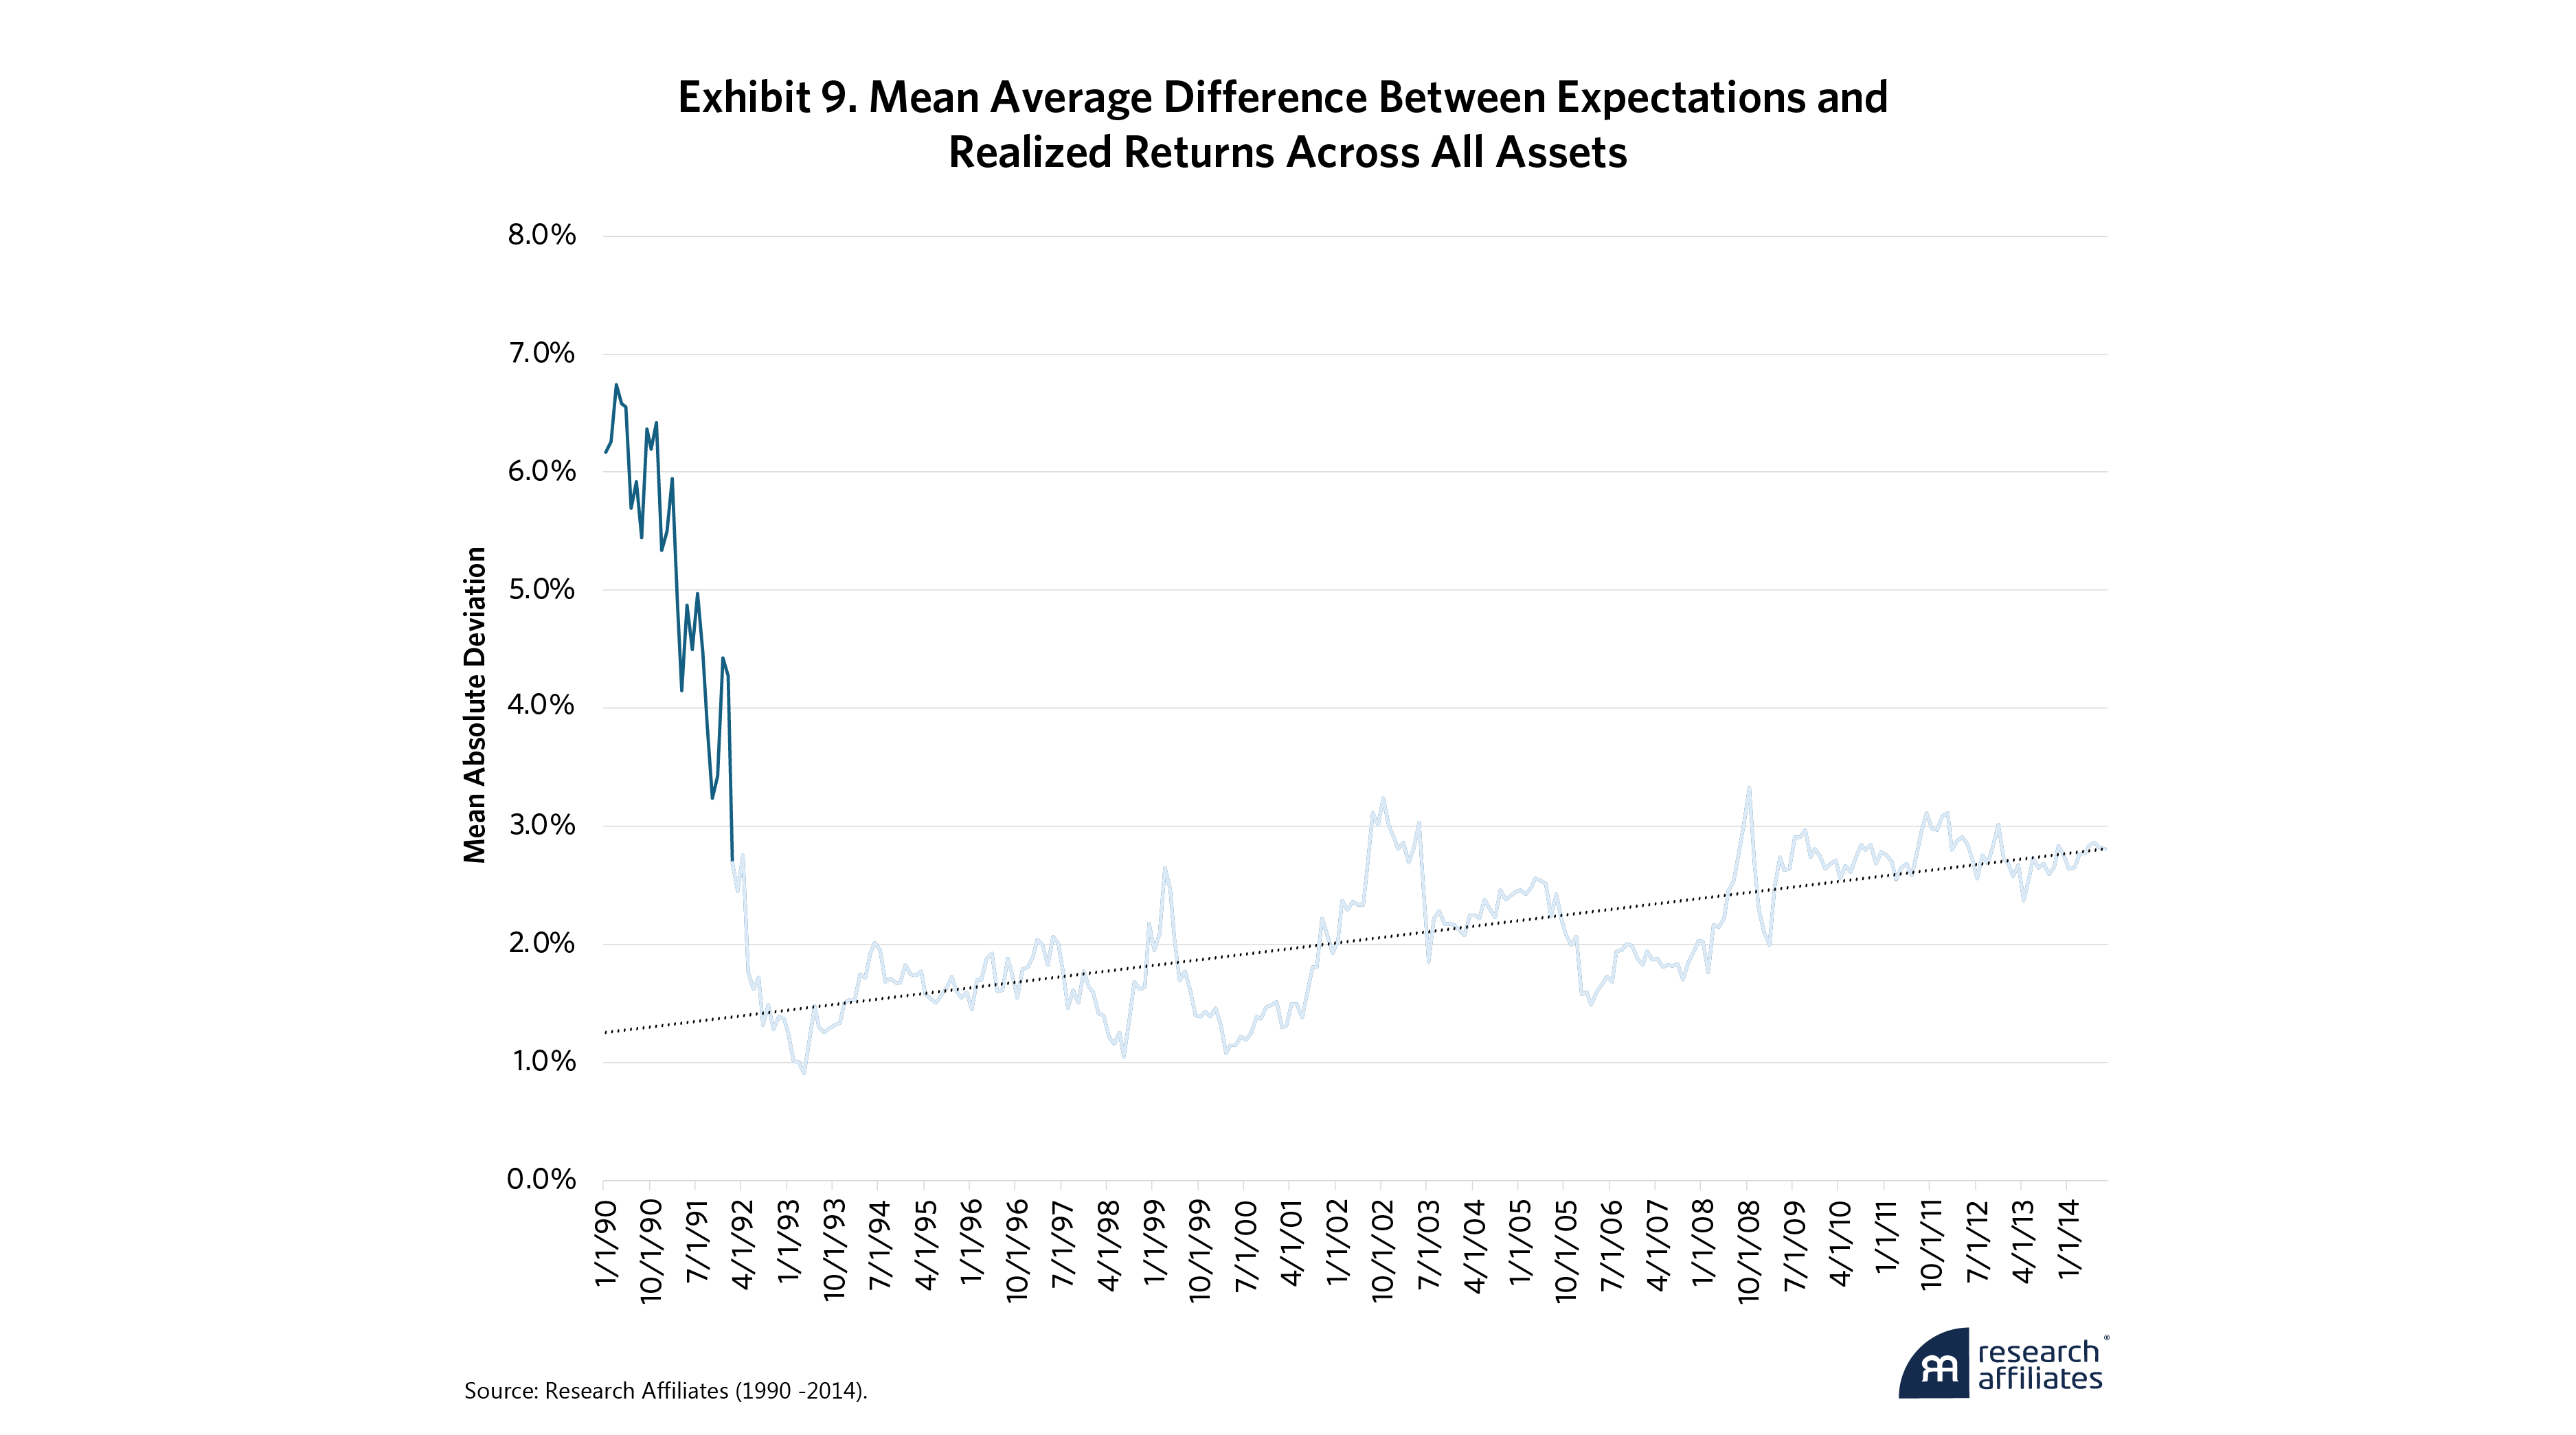
Finally, at the start of the sample, the absolute value of the difference between AAI’s expectation and the realized 10-year return over time across all assets was quite large, more than 6% on average. Expectations from 1990 fell well below realized returns since that 10-year period ended at the peak of the dot-com bubble. Since then, the average difference has fluctuated between 1% and 3%, with a rising trend in the last quarter century reflecting, in part, the upward trend in revaluation.
The values in our models resemble the results of Ma and co-authors, who observe a 3.5% average difference in similar models across a sample covering most of the 20th century. For comparison, they also note this difference is lower than with other commonly used asset pricing models.
The Ugly: Currency Expectations
Any assessment of a forecasting methodology reveals at least one area that falls into the “Ugly” category. With this review, currency return expectations take that prize. This is especially obvious when comparing the fit of the U.S. and international stock and bond models.
The U.S. dollar has strengthened significantly over the last decade, while most global currencies (the Japanese yen, in particular) have weakened. Secular currency trends historically last eight years or so, but this one went on for 12 years and was followed by a dollar pullback in 2022 and then range-bound trading for the last two years. AAI’s expectation of more normalized mean reversion in the dollar didn’t occur and influenced our expectations for all non-U.S., non-hedged asset returns.
Any assessment of a forecasting methodology reveals at least one area that falls into the ‘Ugly’ category. With this review, currency return expectations take that prize.
”Final Thoughts
Ten years ago, Research Affiliates launched the Asset Allocation Interactive online tool, making our CMEs freely available to the public. With one full cycle complete, we can see what has worked well and where we can improve. Across asset classes, when grouped by return cohort, AAI’s expectations have largely reflected future returns, and in the last 10 years, they have anticipated the rank order of most realized returns by asset. This amply demonstrates the effectiveness of AAI as a tool in asset allocation and portfolio construction and should counter some of the skepticism around fundamentals-based CMEs. That said, perfecting AAI is an ongoing effort, and our inflation and currencies models clearly warrant further research and refinement. If there’s one thing we realize, decades may seem long, but in the life of the financial markets, they pass by in an instant. With that in mind, we look forward to reporting on AAI’s continued success in 2034.
Please read our disclosures concurrent with this publication: https://www.researchaffiliates.com/legal/disclosures#investment-adviser-disclosure-and-disclaimers.
The Asset Allocation Interactive website (“AAI”) is an interactive tool created by Research Affiliates, LLC (“Research Affiliates”) for informational purposes only and is not intended to provide, and should not be relied on for, accounting, legal, tax, or investment advice. The tool generates outcomes that are hypothetical in nature and cannot determine which securities to buy or sell. Results may vary with each use and over time. The performance information presented represents simulated performance. Past simulated performance is no guarantee of future performance and does not represent actual performance of an investment product; actual investment results will differ. All intellectual property rights in AAI and any data thereto are the property of Research Affiliates. Neither Research Affiliates nor any of its affiliates, licensors or contractors shall be liable for any error, omission, inaccuracy, or incompleteness in AAI or any data related thereto.
End Notes
1. Boudoukh, Israel, and Richardson (2019) detail issues with overlapping samples. With overlapping returns (e.g., monthly observations of multi-years returns), mechanical smoothing inflates R2 values. But when we reduced the overlap by moving to annual expectations, the R2 reduction was minimal.
References
Boudoukh, Jacob, Ronen Israel, and Matthew Richardson. 2019. “Long-Horizon Predictability: A Cautionary Tale.” Financial Analysts Journal 75 (1): 17–30. DOI: 10.1080/0015198X.2018.1547056
Dahlquist, Magnus, and Markus Ibert. 2024. “Institutions' Return Expectations across Assets and Time.” SSRN, June 8, 2024.
Homer, Sidney, and Martin L. Leibowitz. 2013. Inside the Yield Book: The Classic That Created the Science of Bond Analysis, 3rd Edition. Wiley.
Ma, Rui, Ben R. Marshall, Nhut H. Nguyen, and Nuttawat Visaltanachoti. 2024. “Estimating Long-Term Expected Returns.” Financial Analysts Journal 80 (4): 134–154.
Philips, Thomas K. “Estimating Expected Returns: Then and Now.” Journal of Portfolio Management, June 14, 2024.
