
Small Caps, Big Opportunities: Investing Beyond Large-Cap Stocks
The current valuation gap favoring small-cap stocks signals the potential to unlock value and outperform.
Even though a structural premium to small-cap stocks does not exist, small caps provide abundant alpha opportunities for an active value approach.
Our research demonstrates that successful active investing in this asset class hinges on using three key tools: valuation, quality, and momentum.
A smarter strategy that combines an emphasis on valuation with quality and momentum screens can help investors avoid value traps and falling knives as well as generate enhanced performance.
In an era when a select group of tech behemoths has dominated market returns, investors are growing increasingly wary of the concentration risk it poses. With asset owners now exploring various avenues to diversify their equity allocations, small-cap stocks have emerged as more than just a diversification tool—they represent a compelling investment opportunity. In fact, the “Magnificent 7’s” dominance, a concern we highlighted in a recent article (Arnott et al., 2025), has driven small-cap stocks to trade at a historically wide valuation discount to large-caps. The potential for mean reversion to narrow this valuation gap creates an opportunity for small caps to outperform the narrowly focused large-cap indices over the next decade.
Create your free account or log in to keep reading.
Register or Log in
At the end of 2024, the valuation discount of U.S. small caps relative to a portfolio of U.S. large- and mid-cap stocks stood at -40%.1 This is a deep discount relative to the historical median level of -5%, standing in the bottom 4th percentile since 1990. This valuation gap is certainly influenced by high-flying mega-cap companies. However, even when compared with equal-weighted large-cap indexes, which reduce the outsized influence of mega-cap companies, the valuation discount of small-cap stocks remains substantially wider than normal, as shown in Figure 1.
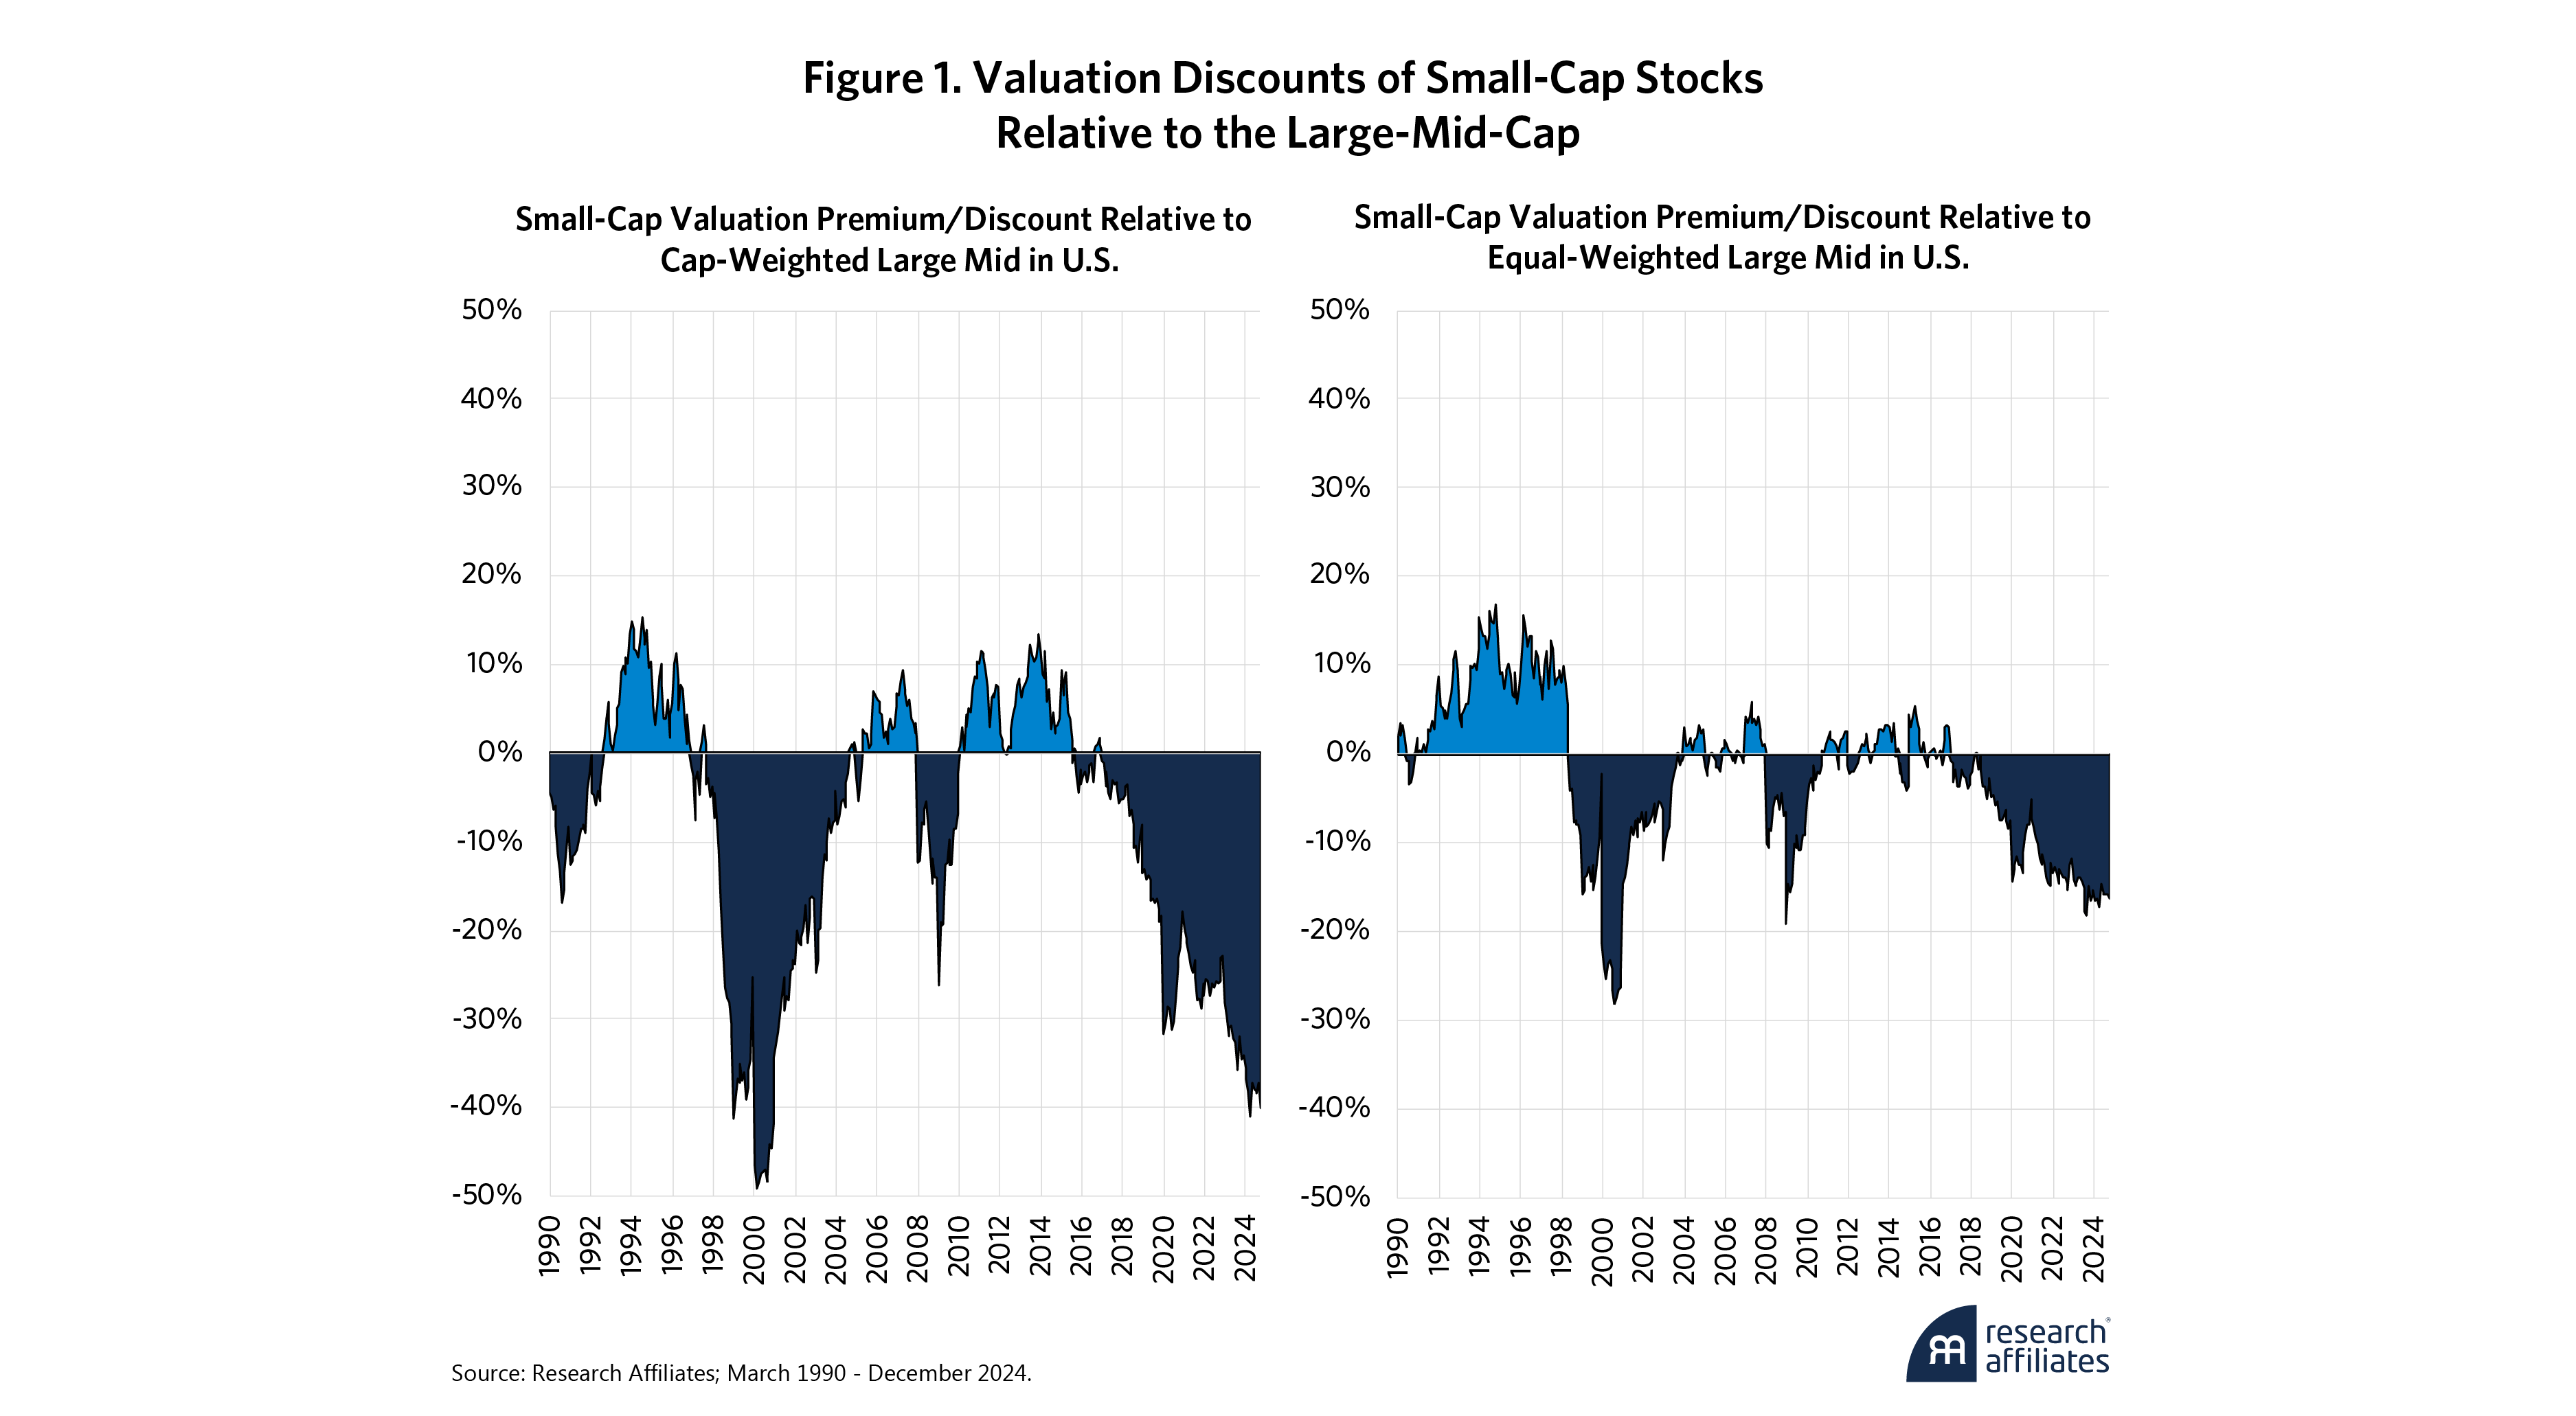
Even when compared with equal-weighted large-cap indexes, which reduce the outsized influence of mega-cap companies, the valuation discount of small-cap stocks remains substantially wider than normal.
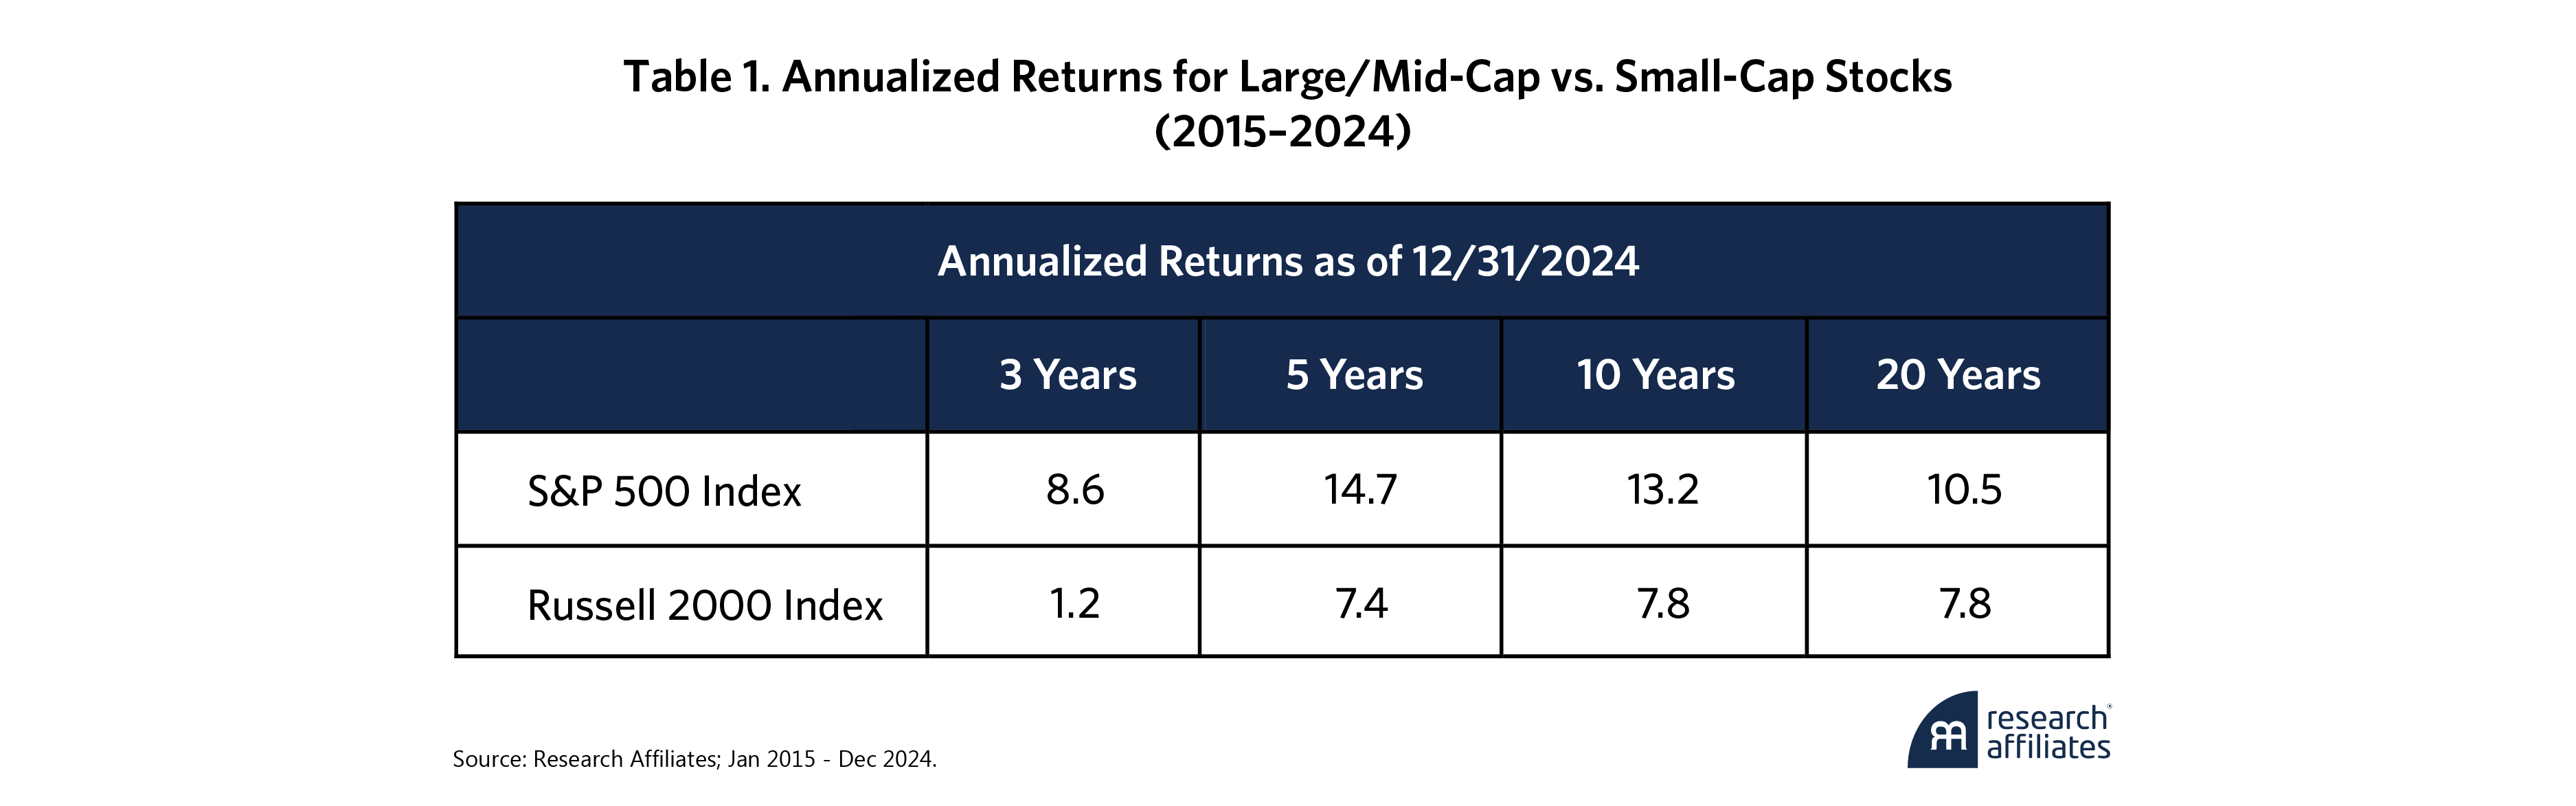
”This valuation gap is the primary driver of our expectation that U.S. small-cap indexes can outperform large-cap indexes by 4% annualized over the next 10 years,2 albeit with greater volatility (see Asset Allocation Interactive). We are hardly the only market observers to note the current valuation opportunity in small caps,3 nor is this the first time we ourselves have noted the attractiveness of this segment of the market in recent years (Nguyen, 2023 as an example). However, as shown in Table 1, the recent history of the S&P 500 Index and Russell 2000 Index performance over the past three years, five years, and even ten years reveals why investors remain reluctant to make major commitments to small-cap investing even at this juncture.
Our past work has argued that while a structural premium to small-cap does not exist, alpha opportunities abound within small-cap, as their greater volatility and lower analyst coverage contribute to greater mispricing opportunities (Kalesnik et al., 2014). As such, a more active management approach to small-cap investing can generate alpha and offer more comfort to investors making allocations. Using data from 1990 to 2024, we demonstrate how a transparent, fundamentals-based approach can enhance small-cap investment results while mitigating investors’ sensitivity to timing when making this allocation.
The recent history of the S&P 500 Index and Russell 2000 Index performance over the past three years, five years, and even ten years reveals why investors remain reluctant to make major commitments to small-cap investing even at this juncture.
”Value: Necessary but Insufficient
Enthusiasm for value investing, especially in the U.S., has faded as the mega-cap rally has gathered strength. Often ignored in this discussion is the efficacy of value within U.S. small-cap stocks. To illustrate this advantage, we construct a simple test using a single valuation metric: book-to-price. We divide small-cap stocks into equally sized quintiles from most expensive to least expensive, rebalancing annually. Figure 2 shows the value-weighted performance of the valuation quintiles. Small-cap stocks show a monotonic increase in performance from most expensive to least expensive, illustrating the power of value investing within small caps.

Enthusiasm for value investing, especially in the U.S., has faded as the mega-cap rally has gathered strength. Often ignored in this discussion is the efficacy of value within U.S. small-cap stocks.
”Astute investors may point out that our time period, which encompasses the tech bubble and burst, includes a period of extreme performance in value that is unlikely to be repeated, which we acknowledge as a valid concern. To assess the impact of this unique event on results, we show the rolling three-year performance of each valuation quintile relative to the total small-cap universe.
As shown in Figure 3, the extraordinary outcome was not in the outperformance of the cheapest stocks but rather in the underperformance of the most expensive quintile during the tech bubble burst. This chart also highlights the reality that the alpha from value investing has been episodic. Periods of underperformance were followed by sharp recoveries, but there was also a long stretch when little alpha was gleaned from buying cheap stocks.
Furthermore, the most expensive quintile exhibits significantly higher volatility (24.8%) than all other quintiles, which range from 17% to 20.4%. While some investors may choose to overlook value within small caps, the historical data clearly highlights the benefit of avoiding the most expensive segments of the market. This advantage can be further enhanced by refining and diversifying the valuation approach—a principle we apply in our investment products. Beyond employing more sophisticated valuation techniques, we leverage our prior research, which underscores the effectiveness of supplementing valuation with quality and momentum indicators.

Avoiding Value Traps and Falling Knives
In an article last year, we highlighted that the challenges of pure value investing, which is often hindered by value traps—stocks that appear cheap but remain undervalued for good reason. To mitigate this risk, we recommended using quality and momentum to avoid “cheap for a reason” and “falling knife” stocks, ultimately improving returns and reducing risk.
Building on that framework, we apply a similar approach to create a more robust small-cap value portfolio. Specifically, we calculate quality and momentum metrics for each stock in our small-cap universe and rank them accordingly. We then apply an annual screen process to remove approximately the lowest 25% of stocks based on quality or momentum measures. Finally, we screen out both poor-quality and poor-momentum stocks. This combined screen removes approximately 40% of small-cap stocks across all quintiles. Because poor-quality or poor-momentum stocks may be more concentrated in certain quintiles, different numbers of names may be screened out in each quintile. The results from this screening process are shown in Figure 4.
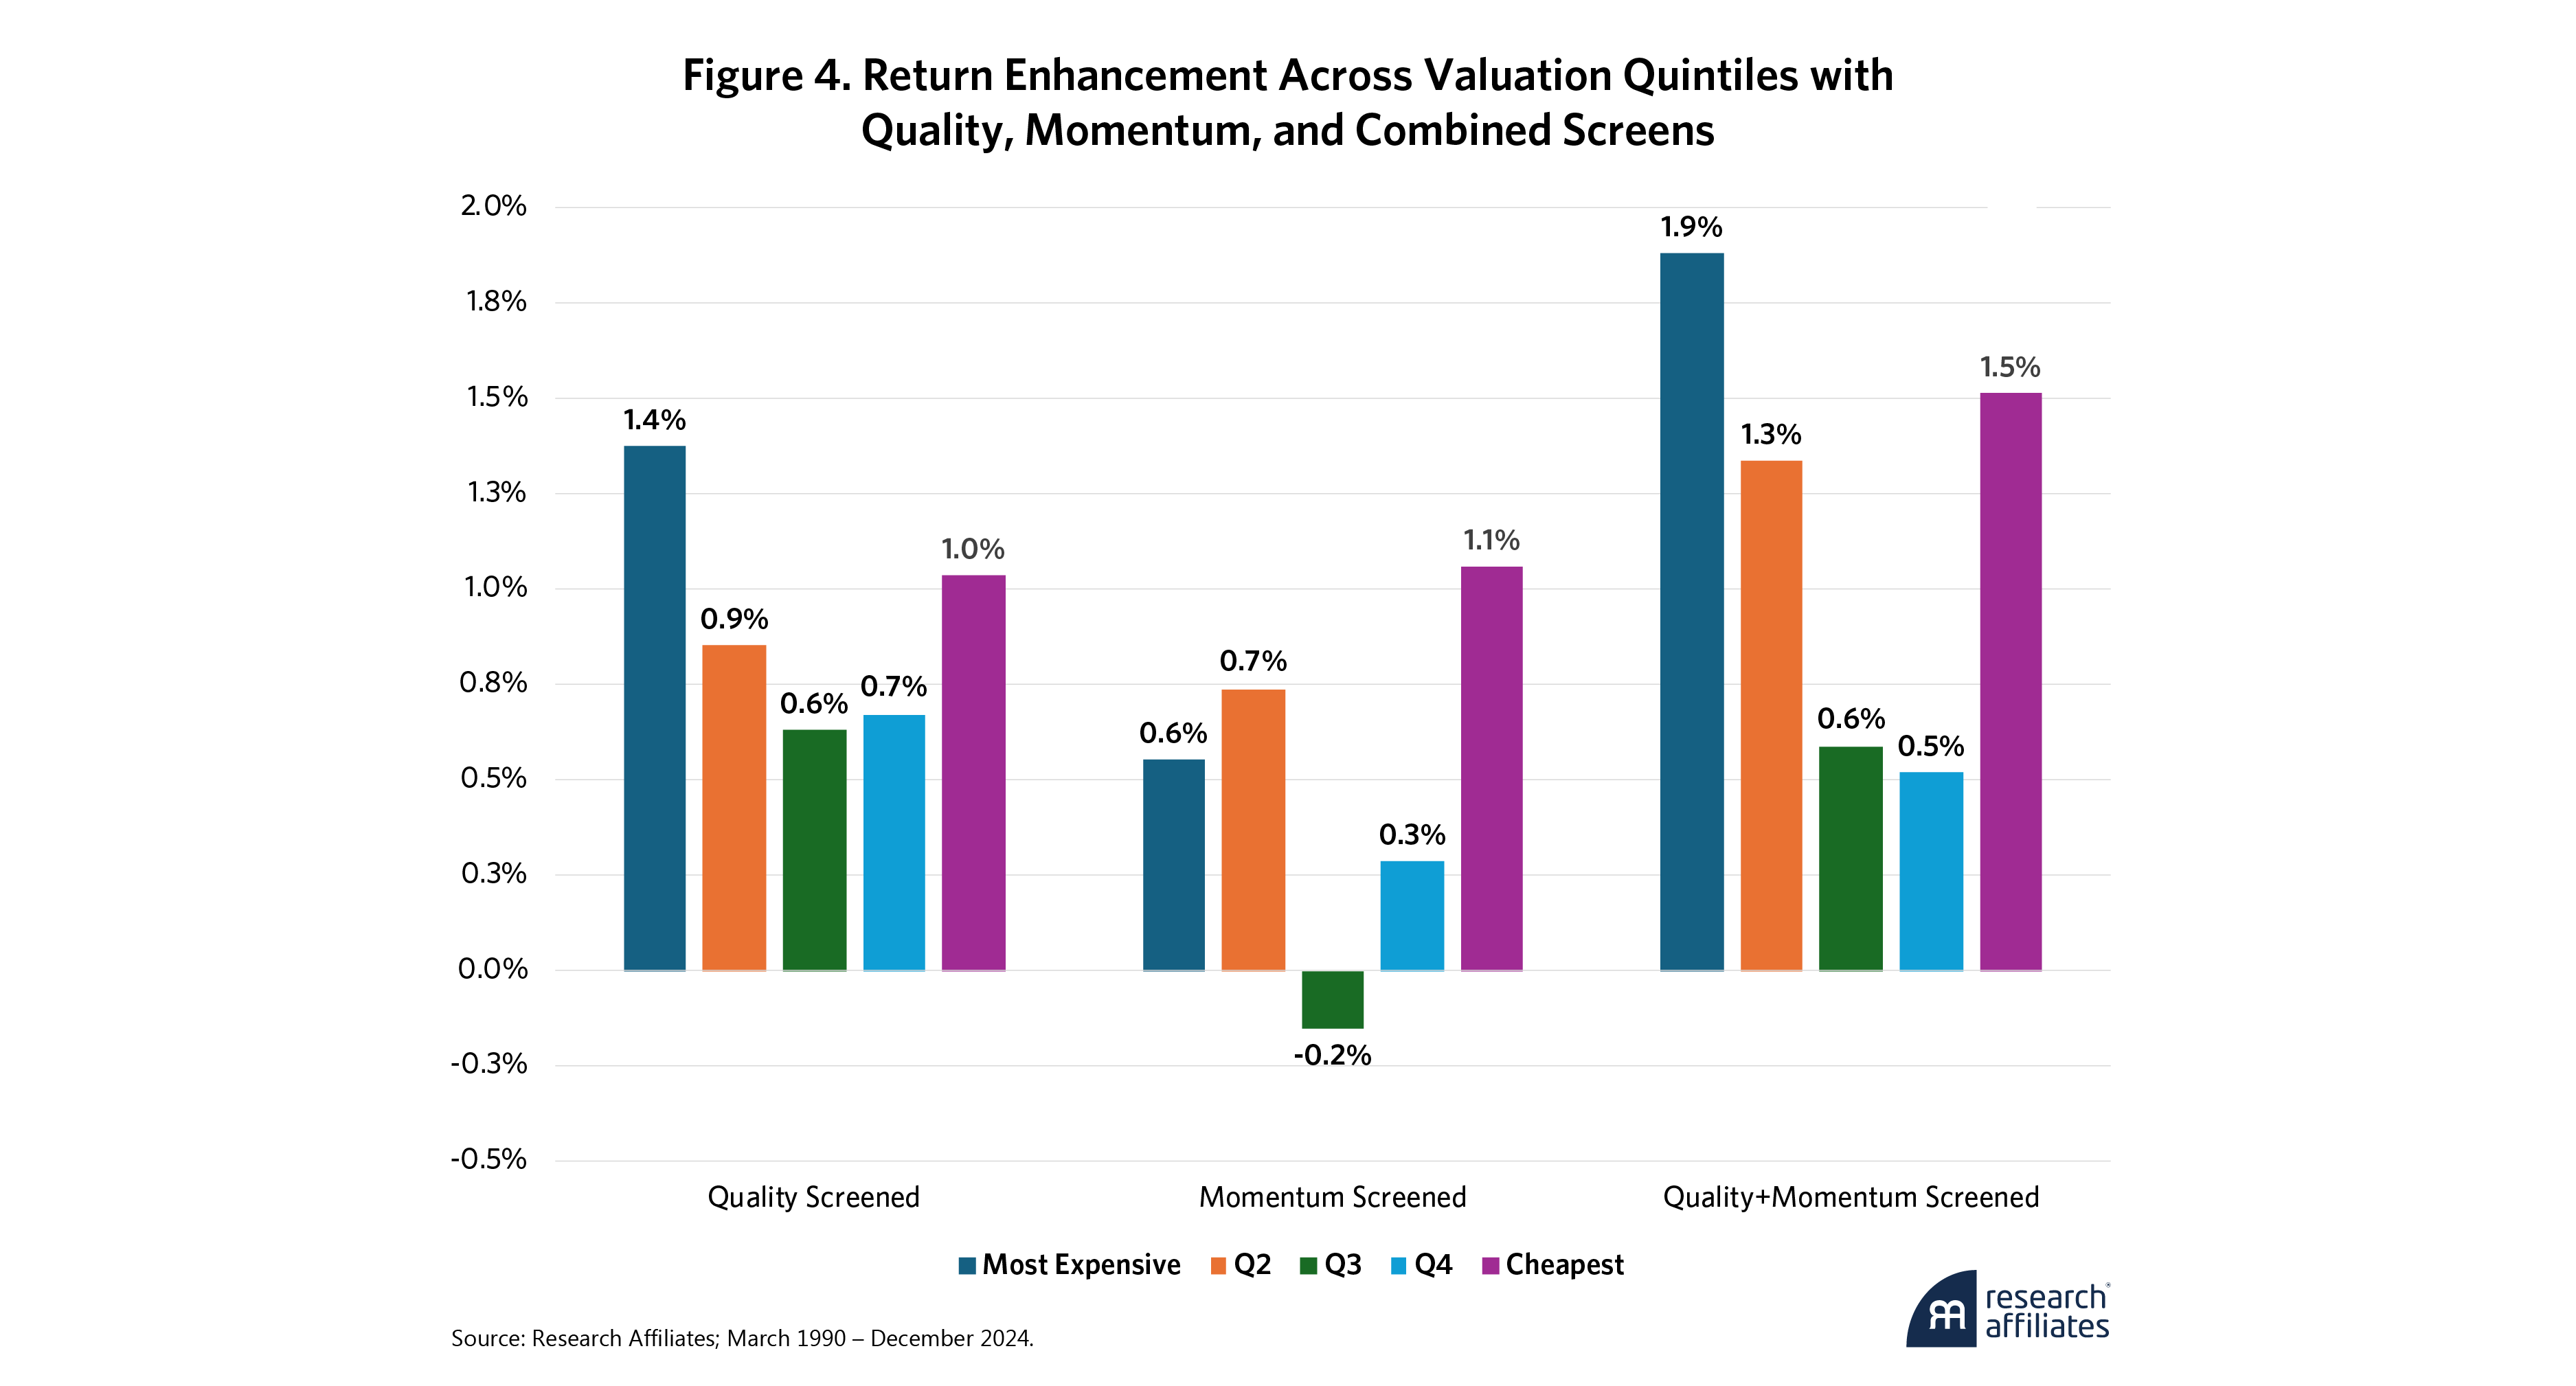
The results of our screening process confirm a familiar pattern: filtering out poor quality and poor momentum meaningfully enhances returns, particularly within the cheapest quintile. Furthermore, applying both quality and momentum screens in combination yields even stronger results. These findings are consistent with our earlier work on avoiding value traps in large- and mid-cap stocks. Screening for quality removes stocks that are “cheap for a reason,” and screening for low-momentum stocks removes “falling knives.”
A more unexpected result emerges in the most expensive quintile. Unlike our findings in the large- and mid-cap universe, where the benefits of quality screening are more pronounced among cheaper stocks, the return improvement for the quality screen is strongest in the most expensive stocks, as shown in Figure 5. This benefit occurs almost entirely in the first third of the time period, with particularly strong performance during the dotcom bust. Since 2002, the benefit to quality screening within expensive small-cap stocks has been more volatile and less consistent. By contrast, the quality screen within the cheapest quintile of stocks never experienced the performance surge seen in expensive stocks. Rather, the screen has been additive consistently over the history, including in recent years. Notably, even after the quality screen, the post-screen performance of the most expensive quintile (8.5%) remains on par with the second-most expensive quintile (8.6%) before any screening is applied.
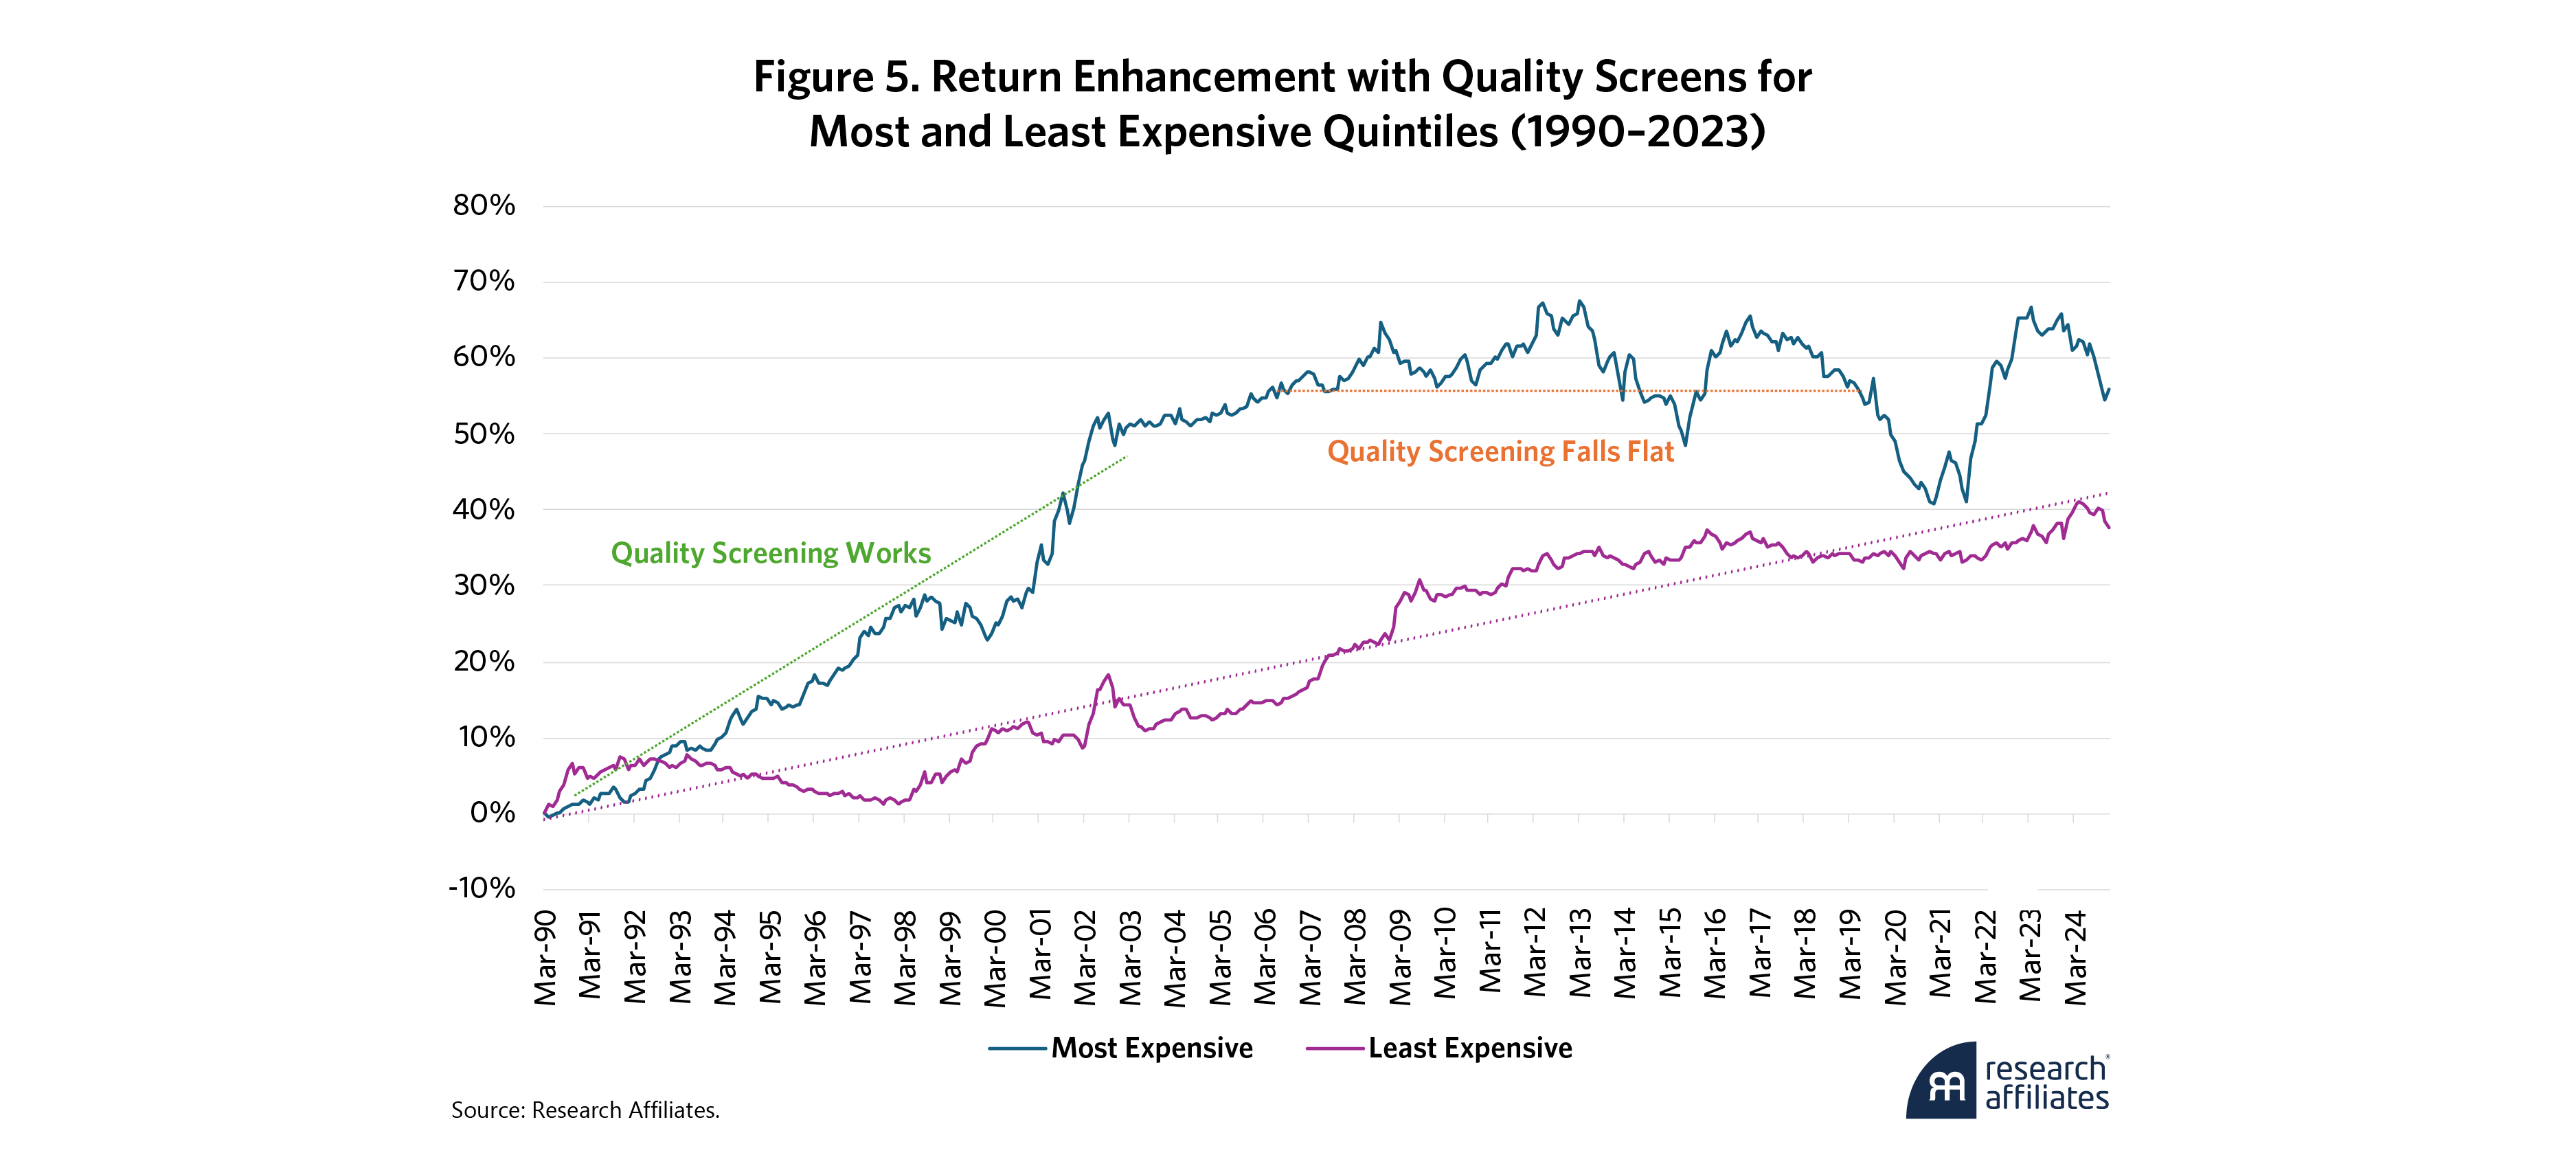
How can this pattern be explained in small caps when it is absent in large caps? Expensive large-cap stocks tend to be large household names with strong balance sheets and cash flow, enabling ready access to financing for such companies. In contrast, the expensive small-cap companies are, by definition, the ones that have smaller fundamentals relative to their price and that, like most small companies, have more tenuous financing access. During the dotcom boom and bust, these companies were able to extend their liabilities, often without showing profitability. As a result, they became highly sensitized to changes in balance sheet health, thus making quality screens effective during periods when financing became much tighter (e.g., the dotcom bubble). In the years since 2002 and especially since the Great Financial Crisis, corporate financing has become more restrained, and as a result, the toxic combination of high debt and low profitability that was seen in the late 1990s has not been nearly as prevalent, making quality screens in the expensive quintile of small caps far less potent. While we are skeptical regarding the potential benefit of quality screening for expensive small caps going forward, we are more confident in its value within small-cap value investing because screening helps distinguish gems from fool’s gold.
What about Risk?
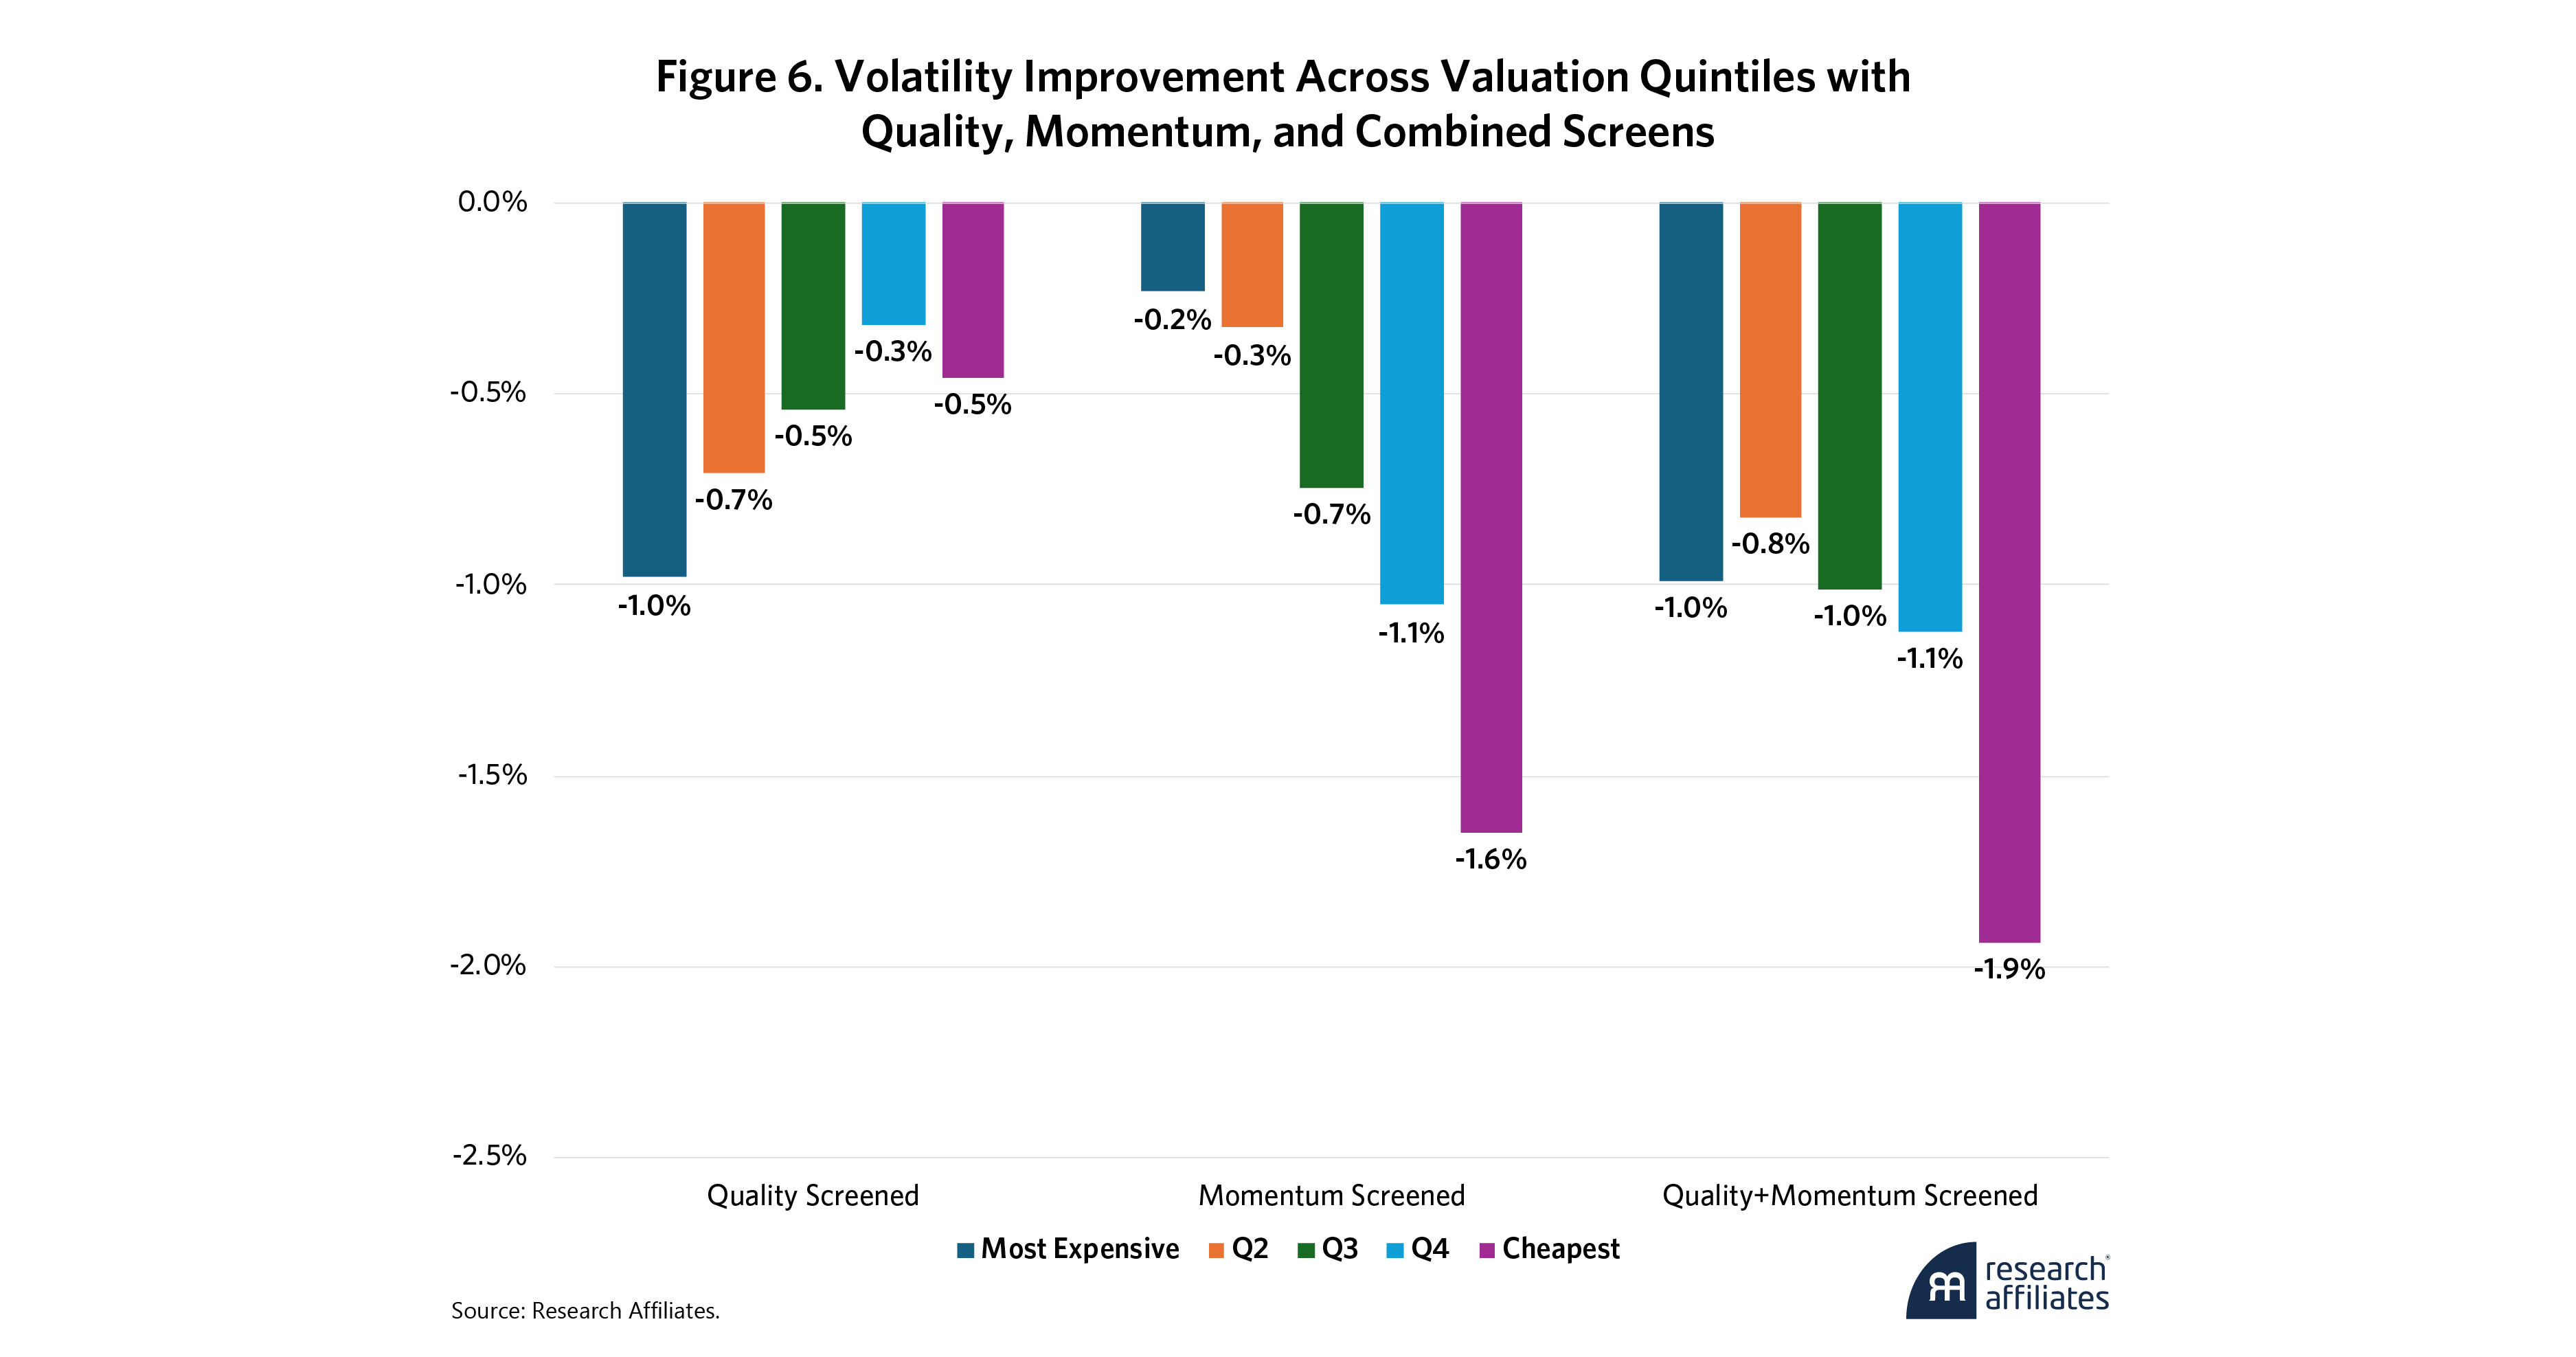
Filtering out stocks means increasing portfolio concentration. Does that necessarily increase risk? Figure 6 reveals that across all valuation quintiles and screening approaches, applying screening actually reduces volatility, which suggests that concentrating on the right names can improve both risk and return. The impact is particularly pronounced for momentum screens in the cheapest quintile and quality screens in the most expensive quintile. This aligns with our earlier findings—momentum helps avoid “falling knives” in deep-value stocks, while quality is especially critical for expensive small-cap stocks, where weaker balance sheets and financing constraints can lead to heightened risk during downturns.
These findings suggest that holding more names does not always equate to lower risk. Instead, effective screening refines the portfolio by removing the riskiest names, demonstrating that a disciplined approach to concentration can improve both performance and stability.
A Better Small-Cap Strategy
To fully illustrate the power of combining value, quality, and momentum within small-cap investing, we show the performance impact in Figure 7.
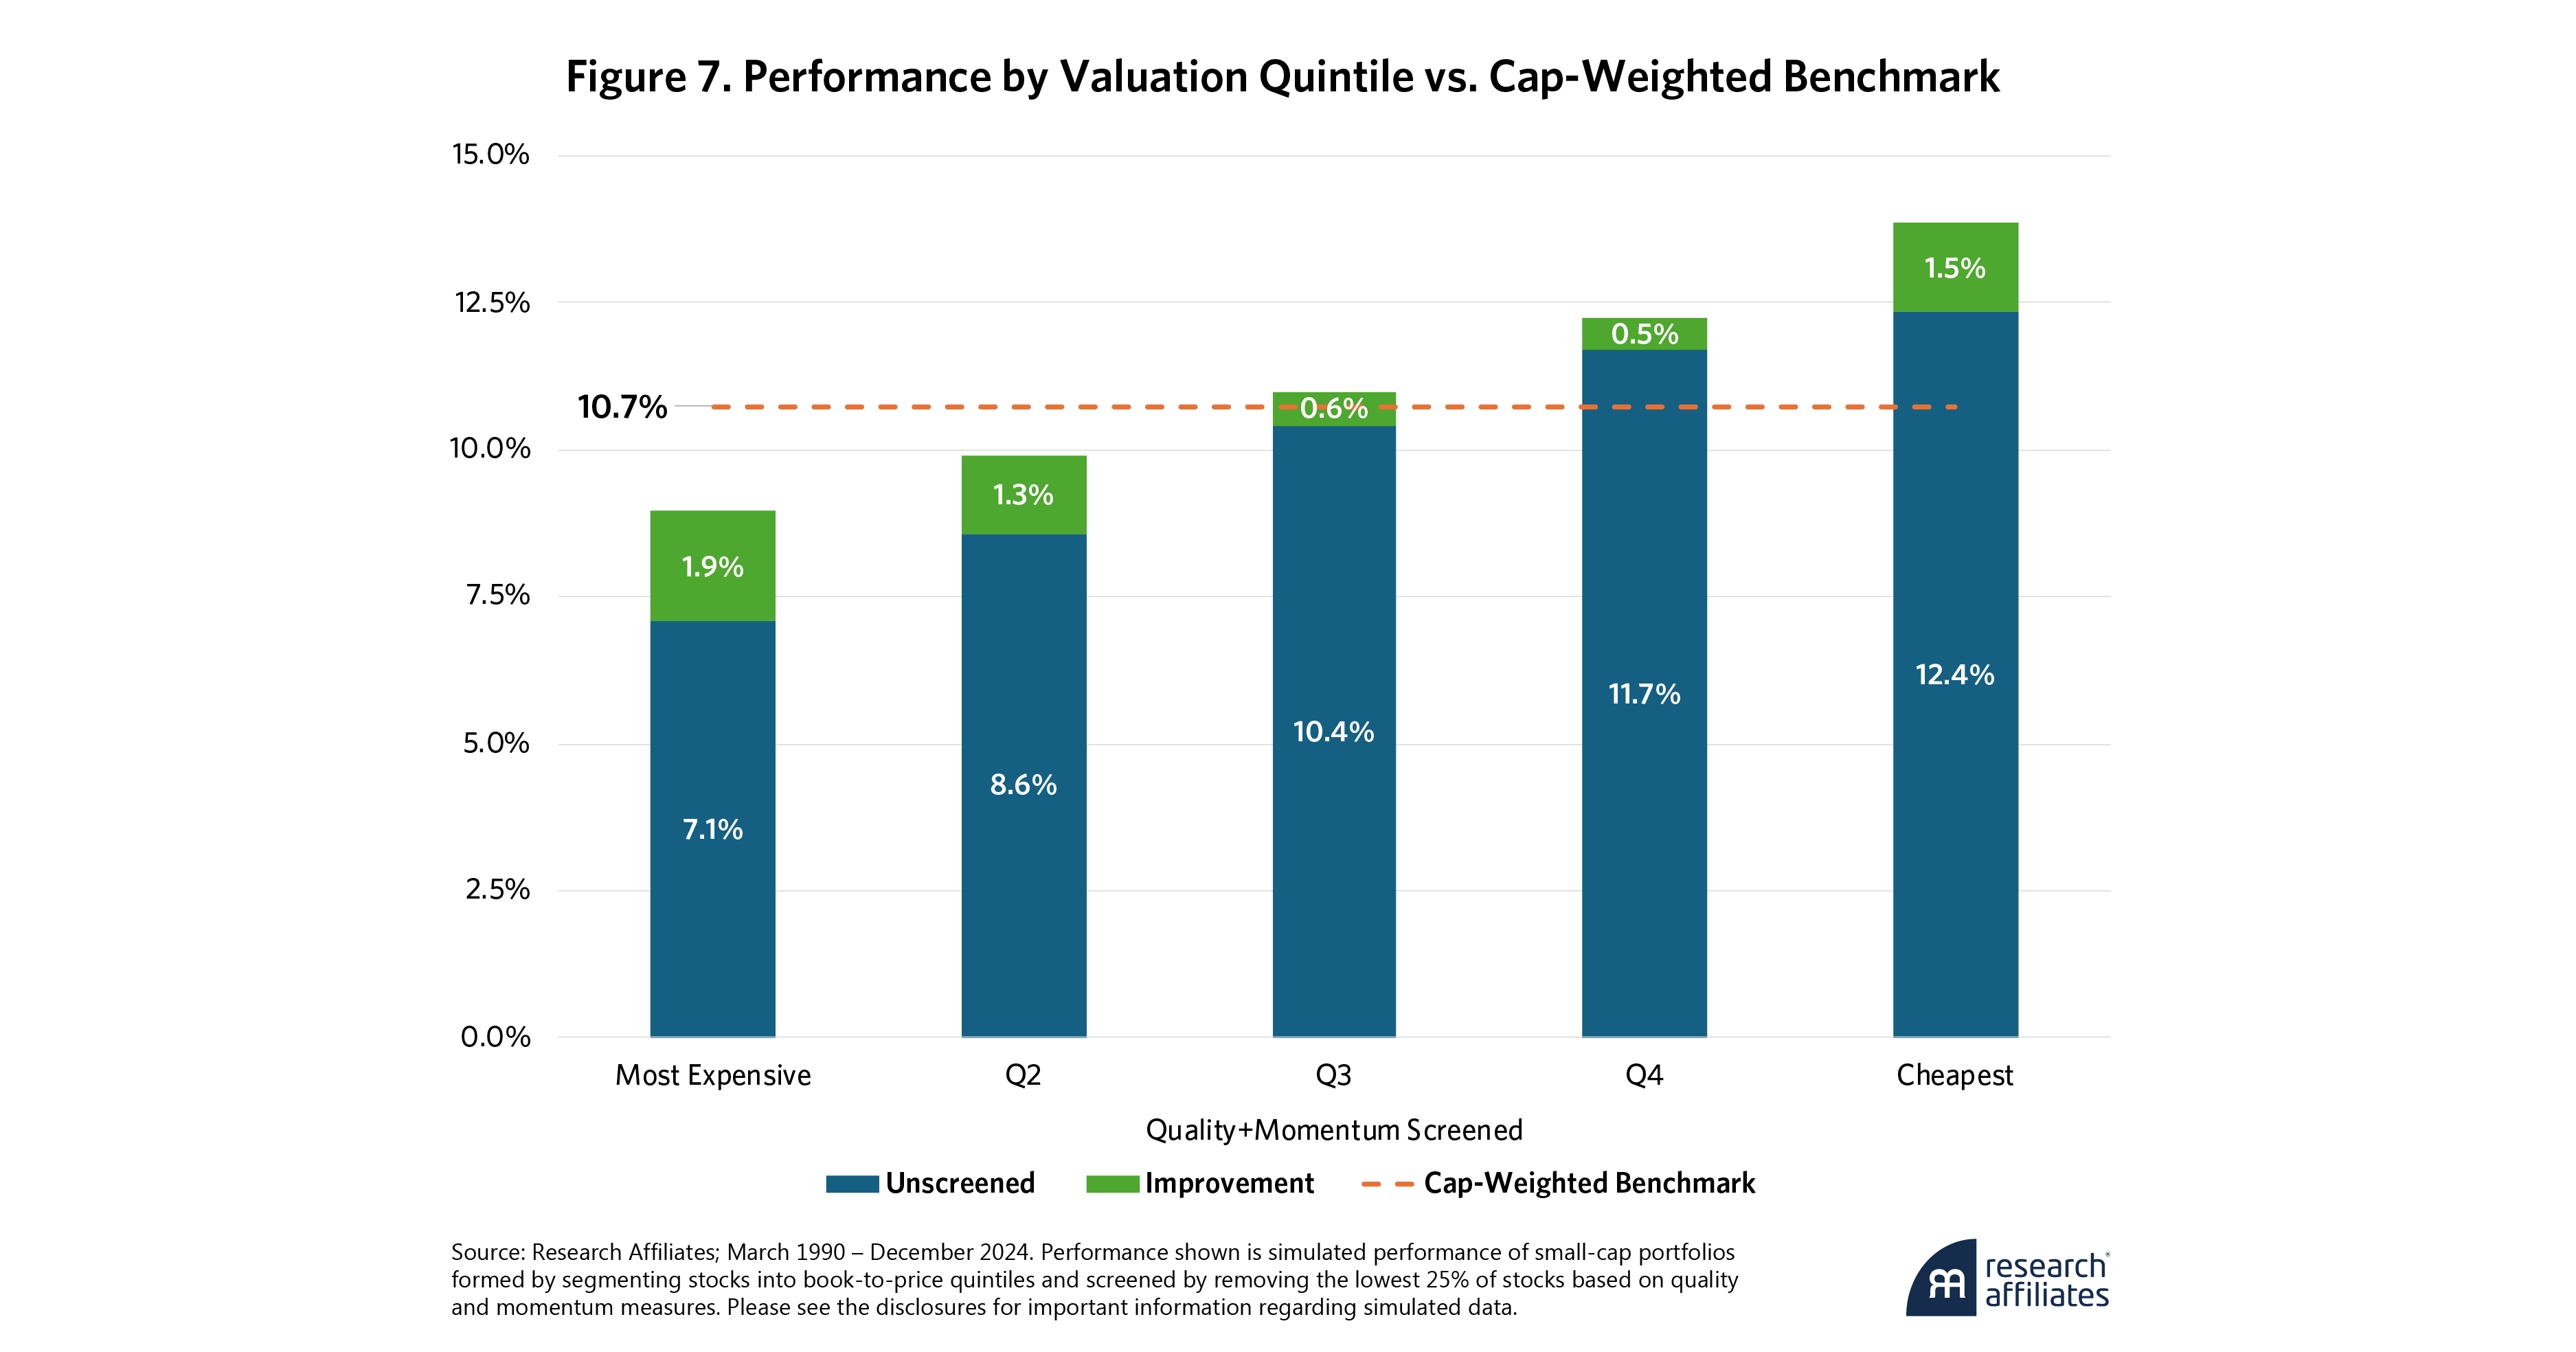
While screening for quality and momentum improves returns across the board, valuation remains a critical foundation for outperformance. Notably, the most expensive quintile starts at a significant disadvantage due to its overvaluation. Although this quintile experienced the largest return improvement through screening, the gains are not sufficient to fully offset its large underperformance relative to the benchmark.
By contrast, the cheapest quintile starts at a significant performance advantage. Screening in this segment is also very effective. Screening nearly doubles the excess returns of the cheapest quintile, increasing from 1.6% to 3.1%, while the second-cheapest quintile sees a 53% boost, from 1.0% to 1.5%.
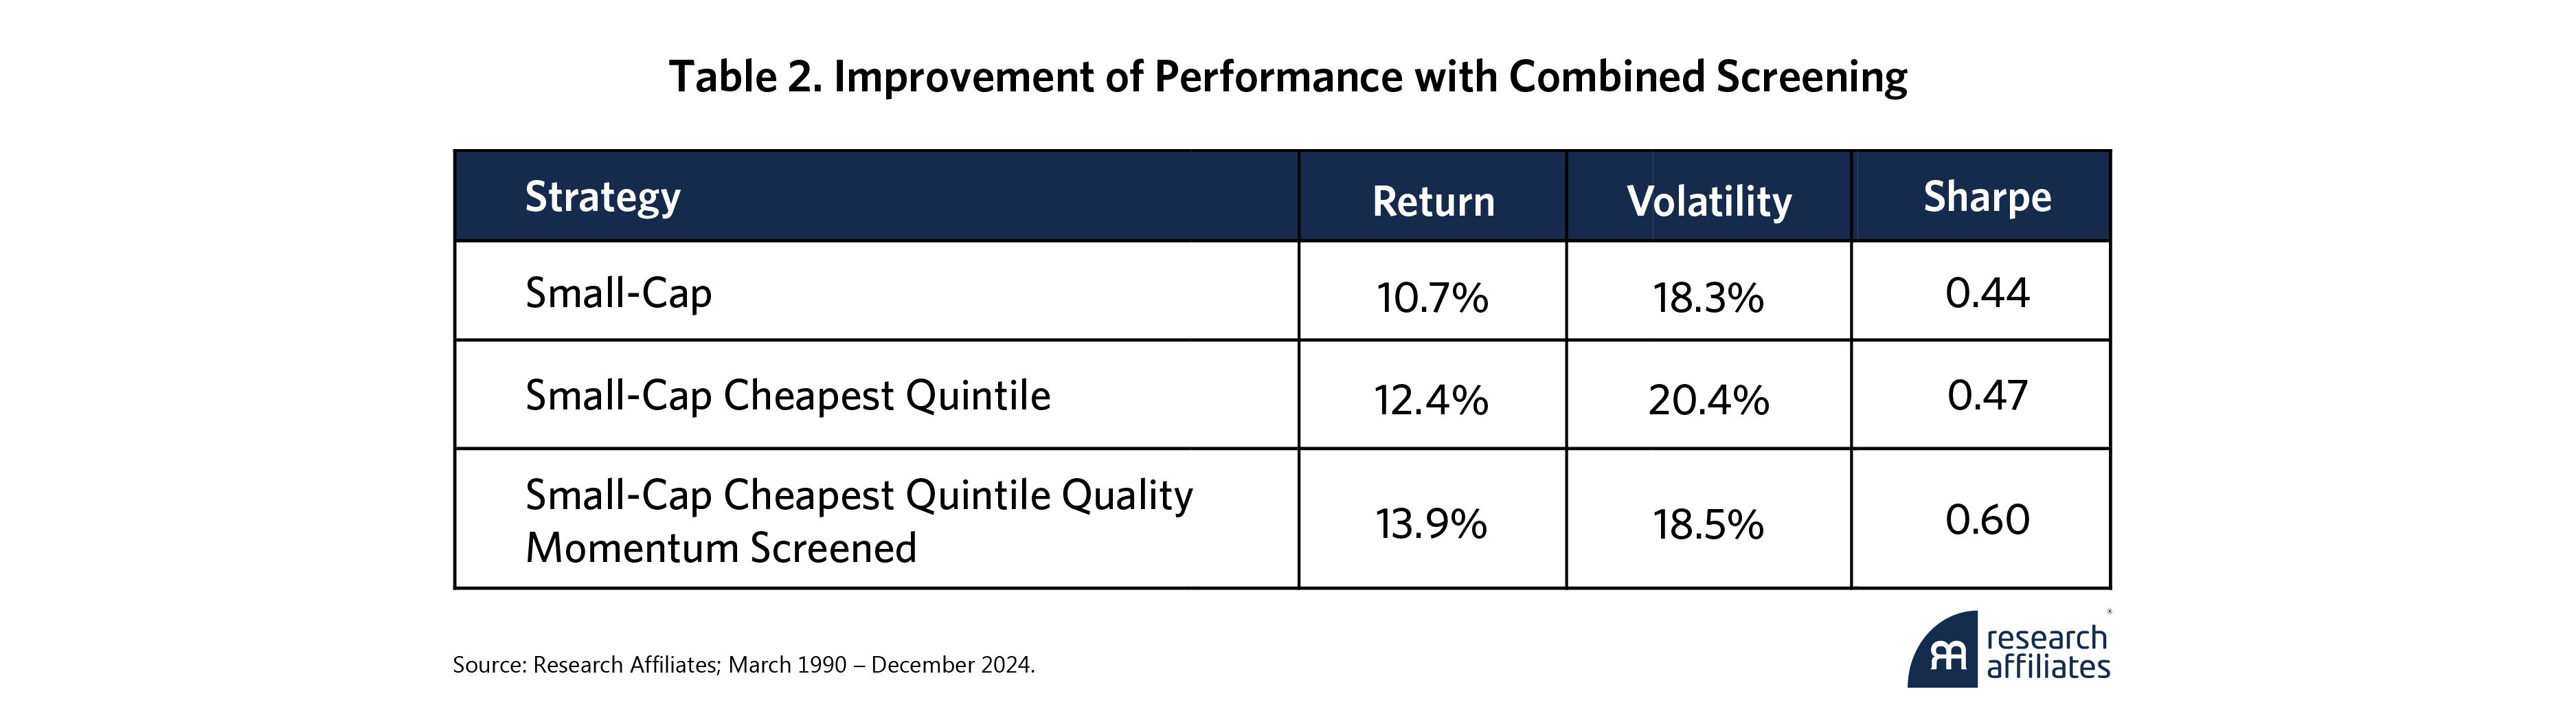
Beyond return enhancement, screening also attenuates the volatility in the cheapest quintile, improving the overall risk-adjusted performance, as shown in Table 2 below. This is reflected in the Sharpe ratio, which rises from 0.44 to 0.60, a 37% improvement. Such a meaningful increase highlights the attractiveness and effectiveness of applying valuation, quality and momentum in small-cap value investing.
Capturing the Opportunity in Small-Cap
In today's market, in which a handful of mega-cap stocks dominate headlines and drive inflated market valuations, the compelling valuation of small-cap stocks is undeniable. However, not all small-cap strategies are created equal. Our research demonstrates that successful active investing in this asset class hinges on using three key tools:
- Valuation: Focusing on the least expensive stocks in the small-cap universe has generated 1.6% outperformance, albeit with higher volatility and episodic performance.
- Quality: Avoiding financially unstable and capital-inefficient stocks improves returns by 1.0% and reduces volatility by 0.5% among the cheapest stocks.
- Momentum: Avoiding poor-momentum stocks leads to significant volatility reduction along with higher returns—reducing volatility by 1.7% while increasing returns by 1.1%.
When combined, these techniques provide striking results and generate a remarkable improvement in returns and the Sharpe ratio.
Today's historically wide valuation discount between small-cap stocks and large-cap—a disparity amplified by the dominance of the "Magnificent 7"—presents a compelling opportunity for small-cap investing. Yet investors remain wary of embracing this exposure. By employing a smarter approach to small-cap investing that emphasizes valuation while avoiding value traps and falling knives, investors can more confidently position their portfolios to capture this opportunity.
By employing a smarter approach to small-cap investing that emphasizes valuation while avoiding value traps and falling knives, investors can more confidently position their portfolios to capture this opportunity.
”Please read our disclosures concurrent with this publication: https://www.researchaffiliates.com/legal/disclosures#investment-adviser-disclosure-and-disclaimers.


End Notes
1. Throughout this article, large- and mid-cap portfolio includes the top 86% of companies by market cap with free-float adjustment, while the small-cap portfolio represents the 86%–98% segment of the universe. The composite valuation ratios are computed as the geometric average of four price-to-fundamental ratios: (1) price to average 5-year earnings, (2) price to average 5-year sales, (3) price to book, and (4) price to average 5-year dividends. Unless otherwise noted, the article uses data from March 1990 – December 2024.
2. In our series of works (Arnott et al., 2016, 2017), we demonstrate that relative valuations are strong predictors of subsequent relative returns.
3. Recent examples include BlackRock and Wellington Management.
References
Arnott, Rob, Noah Beck, Vitali Kalesnik and John West. “How Can “Smart Beta” Go Horribly Wrong?” Research Affiliates, February 2016.
Arnott, Rob, Noah Beck and Vitali Kalesnik. “Forecasting Factor and Smart Beta Returns (Hint: History Is Worse than Useless).” Research Affiliates, February 2017.
Arnott, Rob, Trent Commins, and Xi Liu. “The AI Boom vs. the Dot-Com Bubble: Have We Seen This Movie Before?” Research Affiliates, March 2025.
Nguyen, Que. “Ahead of the curve: Is small cap the next mean reversion trade?” IPE, January 2023.
Kalesnik, Vitali and Noah Beck. “Busting the Myth About Size.” Research Affiliates, November 2014.
Mario Albuquerque, Xi Liu and Que Nguyen. “Active Value Investing: Avoiding Value Traps.” Research Affiliates, February 2024.
