Investing when prices are low and reinvesting to maintain (and upgrade) value are both necessary requisites for successful property investment. Changing fundamentals, such as new construction spend and the vacancy rate, also impact commercial property investments’ real return.
Over the last 5 years, US commercial property investors have earned a real return of nearly 10% a year, surpassing the returns of the previous three decades. We estimate a much lower real return for the next 10 years, similar to the returns earned in the 1990s.
We analyze two scenarios over the next decade—one with property prices sticky at current high levels and one with prices that revert to lower norms. Under both, the annualized expected real return is far lower than property investors earned over the last 35 years: 1.4% and 2.6%, respectively.
I made hay while the sun shone.
My work sold.
Now, if the harvest is over
And the world cold,
Give me the bonus of laughter
As I lose hold.
—“The Last Laugh” by John Betjeman
The dog days of summer are here. The garden is ripe with the tomatoes, cucumbers, and peppers we have dutifully tended. The summer season is truly a time of gastronomical delight, tempting us to try to extend the period of harvest. Should we leave the fruits longer on the vine? Should we plant more seeds? No. The time of planting and toiling is past. Now is the time to enjoy the fruit of our labor, just as the owners of direct property in the United States, who braved the winter winds of 2008–09, are enjoying today. Their efforts are being handsomely rewarded with a real return of nearly 10% a year since 2010, surpassing any of the three decades following the late 1970s when good recordkeeping began. Unfortunately, we do not expect the strong harvest from commercial property to continue in the decade ahead.
The Past Harvest
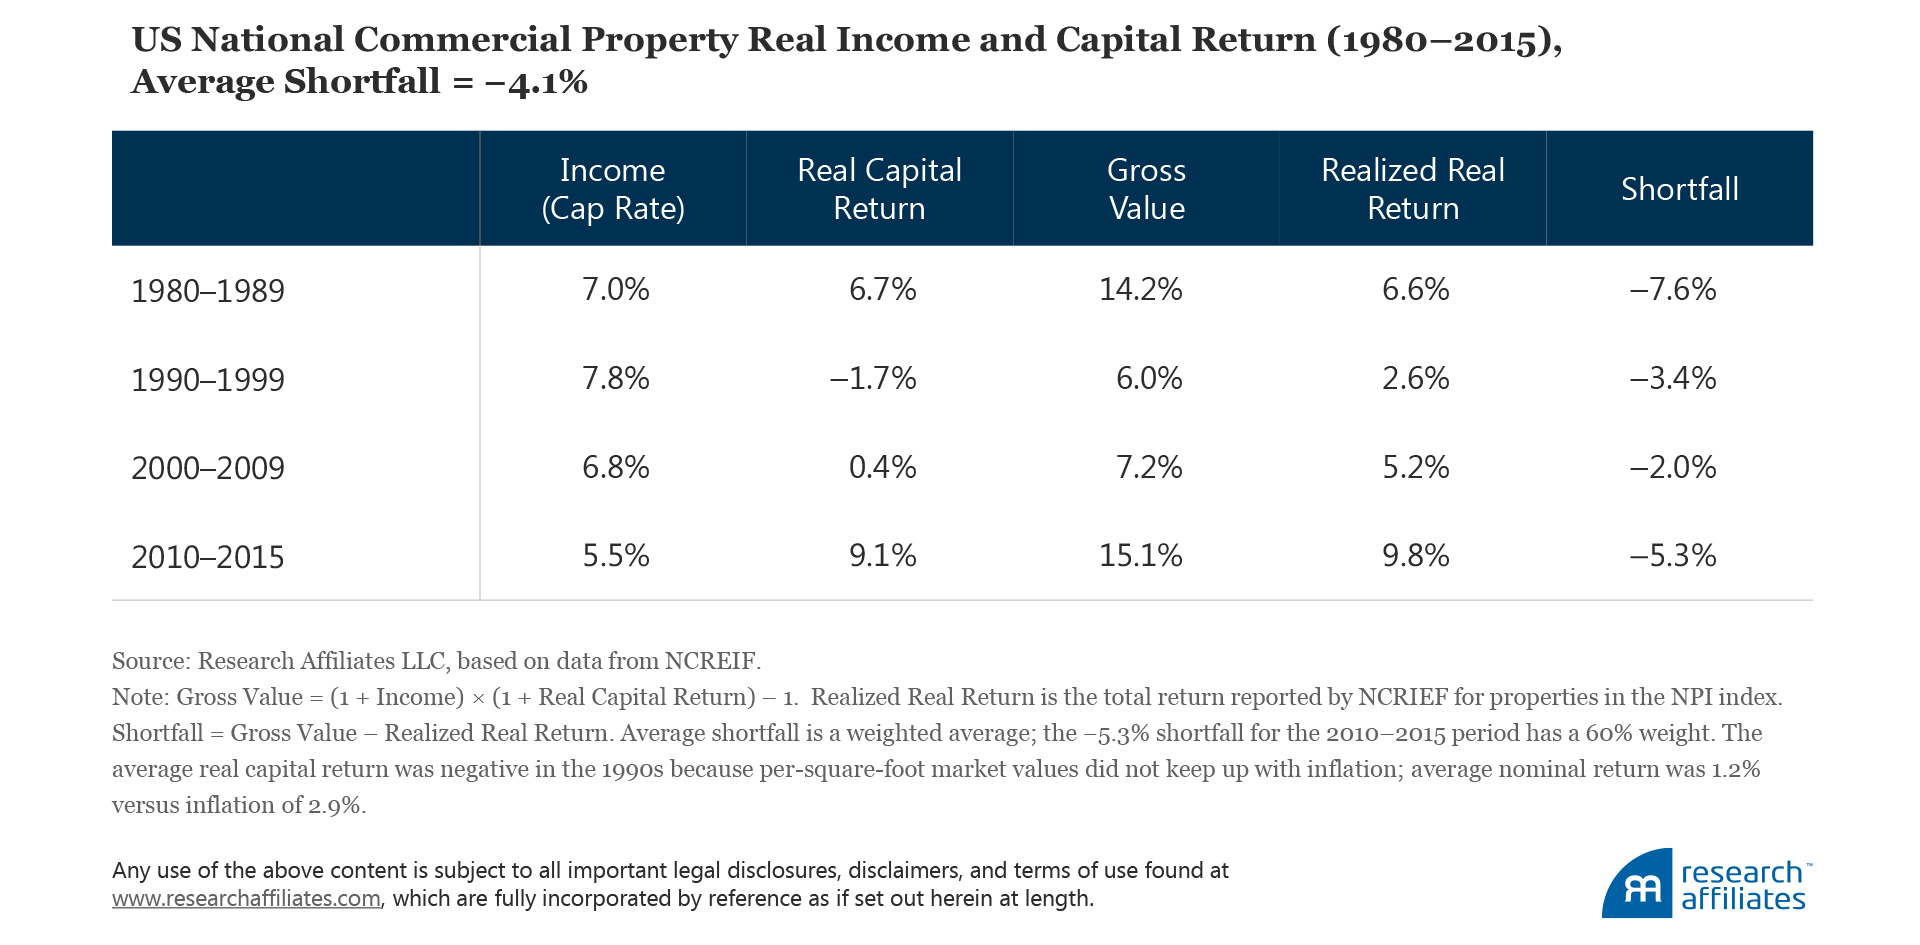
Capitalization rates (income per unit of price) of commercial properties have declined over the last 35 years. The average capitalization rate in the 1980s was 7.0%, in the 1990s 7.8%, in the 2000s 6.8%, but in the 5 years ending 2015 only 5.5%. High prices and high capital returns— although great for owners who wish to sell—when unsupported by income lead to low current yields and inevitably to lower long-term returns as capital price gains outstrip the necessary support of cash flows.
We define cash flow as net operating income following the definition used by the National Council of Real Estate Investment Fiduciaries (NCREIF),1 which is the gross income earned from rent and amenities (e.g., parking, laundry facilities, and vending machines) reduced by operating expenses (e.g., repairs and maintenance, insurance, and property taxes). We define price return as the real capital return, or the real appreciation in average market value per square foot.
These income and price change series are probably the easiest and most accessible judgments of the health and return of direct investment in commercial property. Unfortunately, the gross real return of investing in direct property has fallen far short of the promises of income and price. From 2010 to 2015, the investor real return experience in US commercial property has been 9.8% a year, a lofty number and substantially higher than in the preceding decades, but nonetheless 5.3% a year short of that implied by the income and price appreciation of the properties. The average shortfall for the 35-year period beginning in 1980 is 4.1%.

Like a garden, commercial property is expensive and time consuming to maintain, resulting in a real return shortfall. The constant toil of maintaining a property, not only to the expectations of the current pool of renters but also to compete with newer and upper-scale properties being built, can be a daunting task. We explain how the less obvious costs of being a landlord are important in generating robust forward return expectations. First, we consider the direct costs of property ownership, or the toil of constant property maintenance. Second, we turn our attention to the climate, or the impact of unpredictable property price fluctuations.
The Necessary Toil
The largest and most obvious advantage of property investing is the tangible income, or rent, an owner receives. Gross rents, usually a surprisingly large number relative to a property’s value, can be a deceptive indicator of a property’s income generation. Landlords face numerous calls on cash for capital expenditures (budgeted as reserves for replacement) to repair a building as well as to maintain its competitiveness with newer, cleaner, and better-built structures constantly entering the market. Vacancy, the loss of income from empty offices and apartments, can also be extremely costly.
The amount of reinvestment the owners/investors in a property are willing to make in that property determines the longevity of its income-generating potential. Essentially, three options are available to owners/investors:
- Maintain minimum quality (i.e., little to no reserves for replacement = maximum aging). The owner undertakes the minimum amount of capital investment in the property to maximize the income yield. The property will, however, suffer the maximum amount of degradation, known as aging, pushing the quality of the building over time into a cohort of lower-quality buildings, and in turn lowering its cash flow potential. Although the investor initially receives the maximum amount of income per year, the value of the building quickly declines over time.
- Maintain constant quality (i.e., average reserves for replacement = average aging).The owner undertakes enough capital investment to keep the building at a constant-quality level defined as the level of quality on the day the property was completed. By doing so, the investor receives less income because of the reinvestment, but the building suffers less aging. Nevertheless, the property effectively depreciates relative to newer buildings being constructed with fancier bells and whistles, and is therefore no longer considered as desirable as it once was.
- Maintain current quality (i.e., maximum reserves for replacement = little to no aging).The investor undertakes the level of investment necessary to keep the property at the most current level of quality, including integrating new technology and building standards as they are developed. In this case, an A-grade building can maintain its rating, and thus stem the tide of aging, by constantly upgrading to match the current definition of an A-grade building. This level of investment, however, is usually much greater than the benefits available from rent increases over the building’s lifetime.
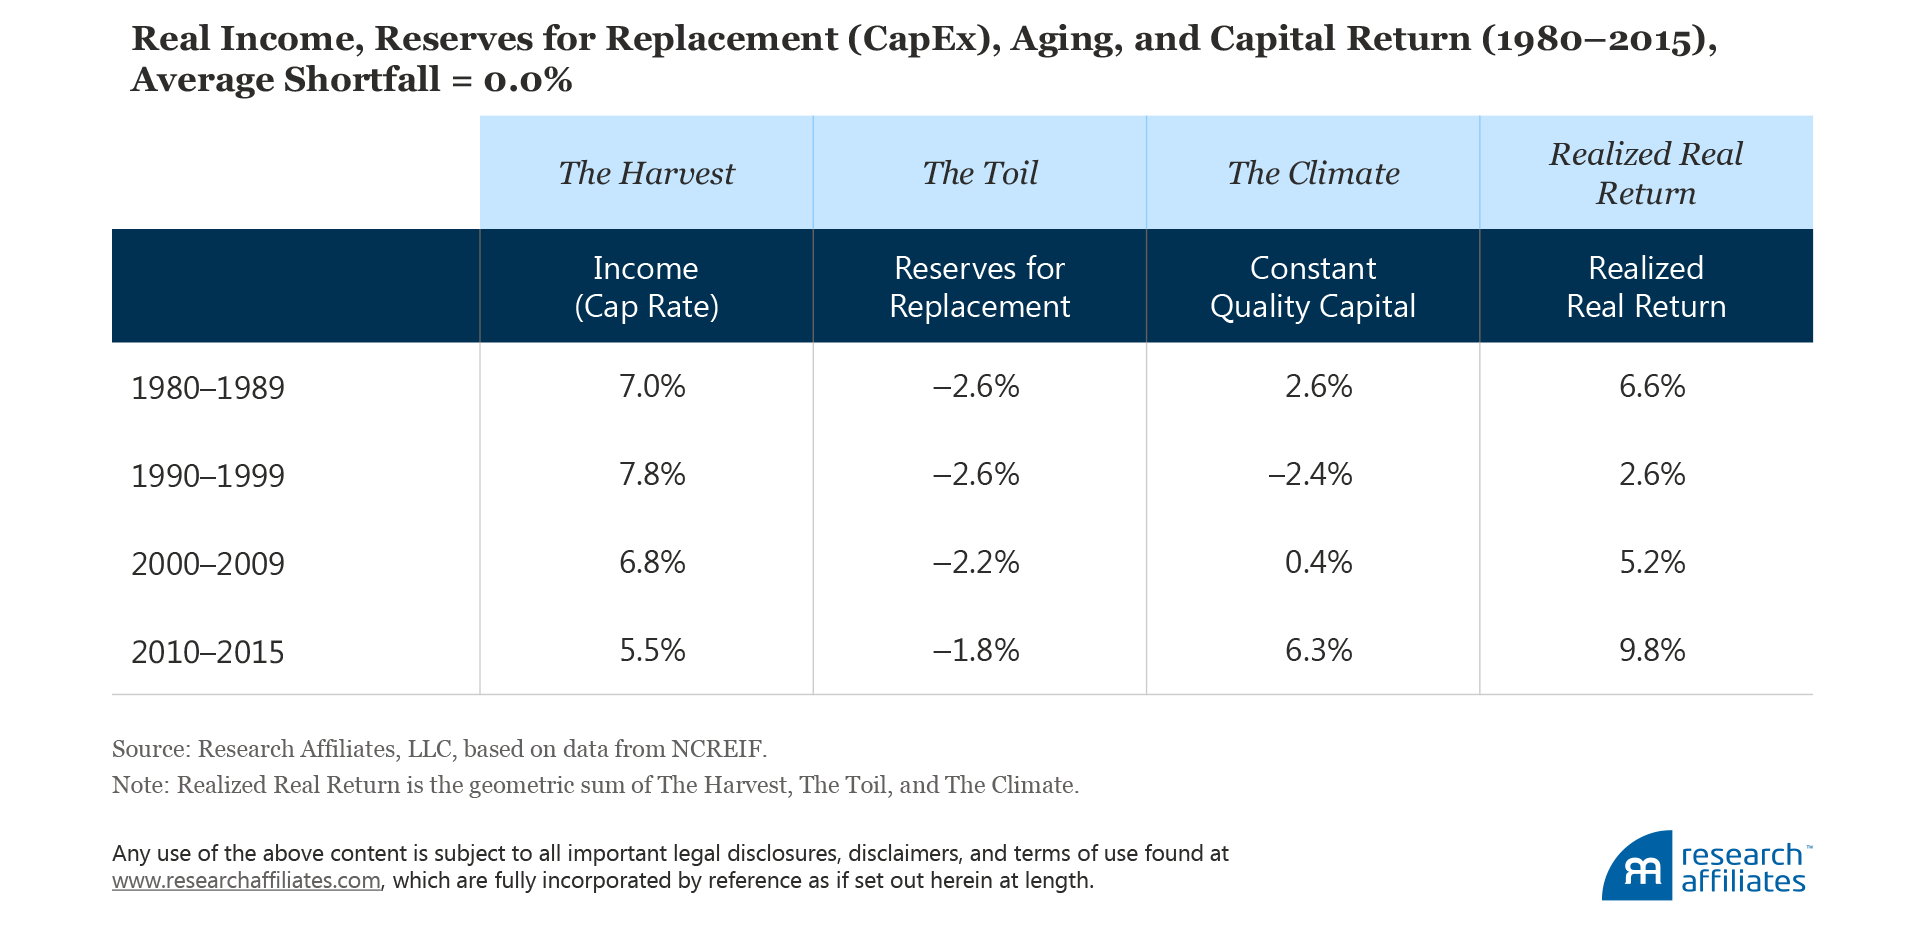
For our analysis, we consider the constant-quality scenario in estimating reserves for replacement and aging because it is the most common of the three scenarios. In property investment, capital expenditures are lumpy over time because upgrades—a new HVAC system or new roof, for example—may require a large capital outlay one year, followed by much lower expenditures in subsequent years. Over the last 35 years, the average capital investment required to maintain buildings in a state of constant quality was roughly 2% of market value.

The Unpredictable Climate
Properties maintained at the quality of their construction cohort (constant quality) are less desirable to renters as time goes on. The difference in the property price appreciation of a portfolio of current-quality properties compared to a portfolio of aging constant-quality properties can be dramatic. Over the period from 1980 through 2015, on a year-by-year basis, this difference ranged from a high of nearly 15% in the early 1980s to less than 5% today. However, on a decade-by-decade basis, the average has been between 1% and 4%.

For an owner/investor, the level of expenditure required to keep a property at current quality is financially inefficient; however, investors do have other options. The ability to turn over properties in a portfolio, by adding higher-grade properties and selling lower-grade properties, keeps the overall quality of the portfolio from slipping. Of course, such portfolio upgrades come at a cost because buyers of older buildings demand a price discount to compensate for aging. Therefore, from an investor’s standpoint, assessing the return prospects of the real constant-quality series is of greatest practical interest because it is actually owned, rather than aspired to.
Property investors can relatively easily invest in both new construction and existing properties, making the buy-versus-build decision a plausible tradeoff. Although new property development opportunities are plentiful around the world, the market is not without barriers to entry. Location, zoning laws, taxes, higher building standards and new regulations, among other considerations, are all tangible factors in the buy/build decision. Over a full cycle, property values are thus rooted to replacement costs, but at different times in the cycle more or less strongly.
Real constant-quality prices for commercial property have moved cyclically around a stable level for close to 40 years. Using long-term average valuation, we determine that current constant-quality property prices are now 20% above trend. This is decidedly a rough method to determine an equilibrium price, and more complex methods are available. One such method would be to utilize Tobin’s Q. As measured by Nordby and Taylor (2013), average Tobin’s Q ratios across major US markets were in the range of 0.85–1.36 (1.0 = indifference) over the period 2000–2012, with cities such as New York and San Francisco at the upper end of the range. Evaluating ongoing changes in Q ratios could provide a better metric to evaluate current valuation levels; however, we believe our trend method, although a rough approximation, leads to a similar conclusion as more complex methods.

Over the last 35 years, accounting for the reserves for replacement and aging that are necessary to maintain a building at constant quality (constant-quality capital), we can fully account for differences in value between the return expected based on a property’s fundamentals and the return realized.

The Current Season
Low property cap rates, barely above reserves for replacement plus aging, and driven by a low-income-to-price relationship that has been falling for quite a few years, indicate the extreme expensiveness of commercial property in the current market. Current levels of overvaluation therefore imply a correction and may even imply a crash, as intimated by the Wall Street Journal in a recent article tagline: “As valuations of stocks and property swell, a sudden shift in sentiment could destabilize growth” (Ip, 2016). We say, not necessarily. Although we would not be surprised by a future correction, fundamentals other than price must be considered.
Two fundamental drivers of property prices—construction spend and vacancy rate—determine both the new buildings to come online and the amount of wasted space in the current collection of properties. Both fundamentals display a cyclicality whose direction abruptly changes during recessionary periods: higher then lower for construction spend, and lower then higher for vacancy rate. Since the last recessionary period ending in 2009, the growth rate of spend has been lower compared to the previous two nadirs, implying fewer new buildings being added to the mix. One reason could be decreased lending after the great financial crisis. The low level of real construction spend is unusual considering vacancy rates are near all-time lows. The combination of building leasable space at near capacity and fewer new buildings suggest that even though property prices are high, a lack of longer-term capacity might hold them there.

The Next Season
The Research Affiliates model uses a building-block approach to estimate global asset class expected returns.2 For commercial property, we estimate expected real return beginning with the anticipated capitalization rate adjusted for our assumptions about reserve requirements and the expected constant-quality price change.
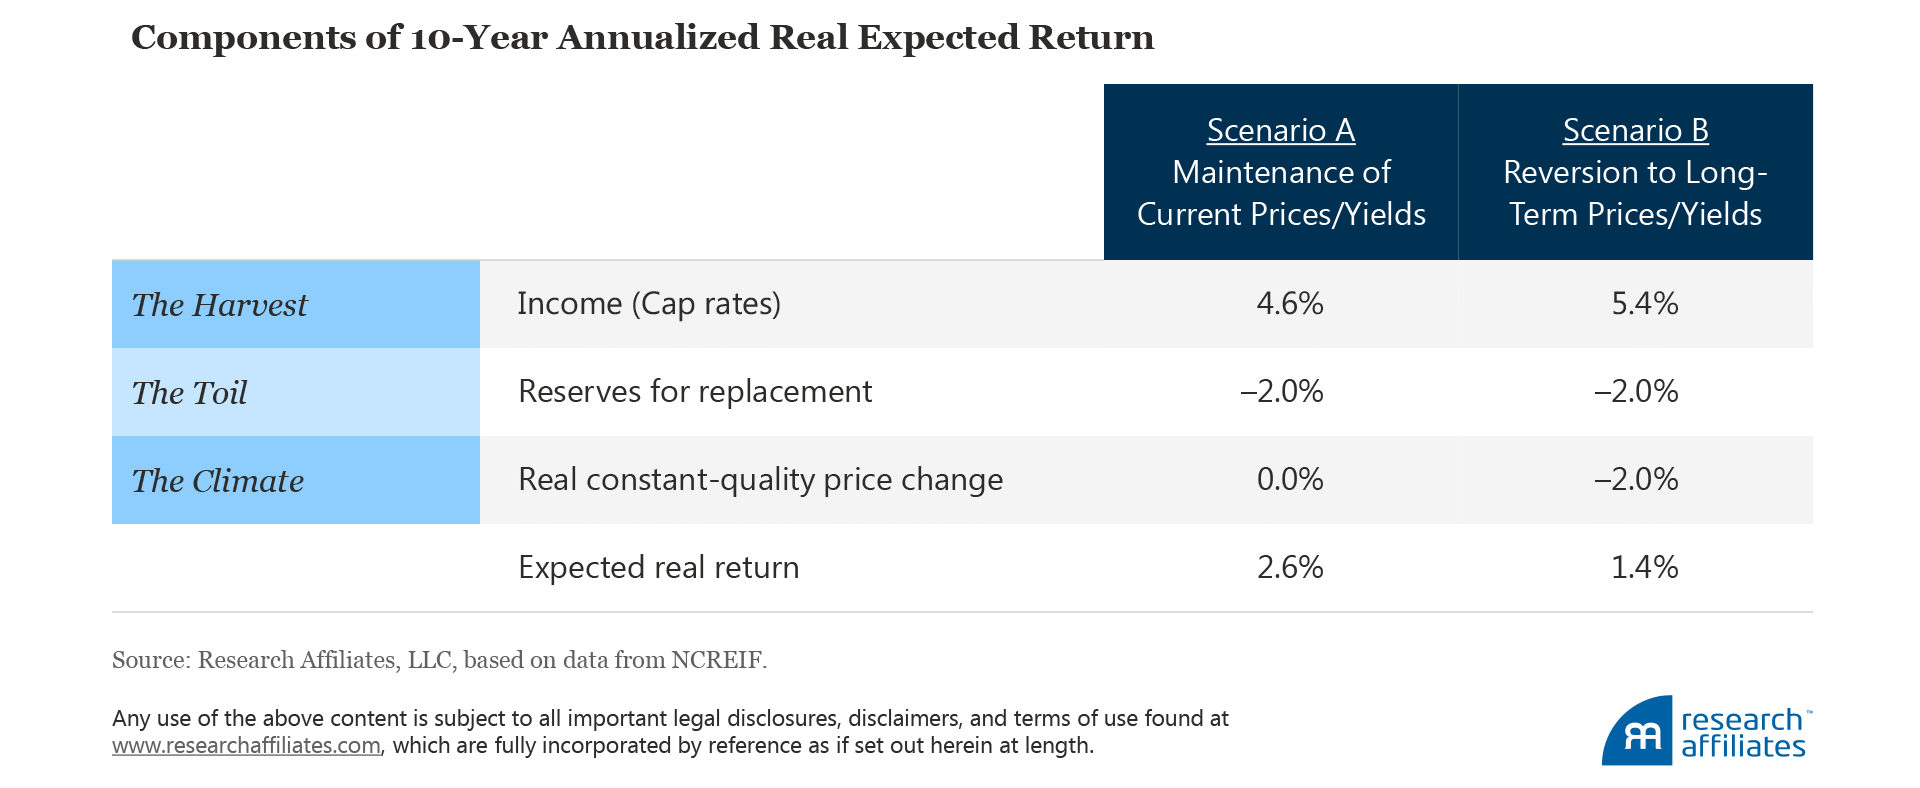
Let’s consider two possible future scenarios for the property market. In Scenario A, property prices stay near the current cap-rate multiple of 4.6% (i.e., prices remain high over the next 10 years). Considering a 2.0% reserve and 0.0% price change, the expected real return is an annualized 2.6%. Scenario B assumes a reversion of cap rates to more normal levels over the next 10 years, implying income of 5.4%. Assuming a 2.0% reserve and −2.0% price change, under this scenario the annualized real return is 1.4%. The important takeaway is that, under both scenarios, the expected real return over the next decade is far lower than property investors have realized over the last 35 years.

We can add granularity to Scenario B by extrapolating our assumptions to the return prospects of 16 property type and regional segments and examining their respective weights in the total property portfolio. Apartments appear to be an attractive segment of the market with an aggregate 3% real expected return, but as only a small part of the value-weighted portfolio, consequently adds little to total expected return. The Office segment, with an aggregate real expected return of zero from the heavy weight in the negative-expected-return East Coast region, has a much greater impact in the value-weighted portfolio, depressing the overall expected return for US commercial property over the next decade.

Prospects for the Future Harvest
Investing in property is similar to the widespread practice of gardening in northern latitudes: seasonal and full of hard toil, but at harvest time often reflected upon as a less demanding endeavor than it actually was. Likewise, after a period of great returns (similar to the abundance of the harvest), it is tempting to believe property investments will provide in the future as plentifully as they have in the past. Acknowledging that planting when the weather is cold (cheap prices), toiling is necessary to encourage growth (reinvestment), and the presence of a variable climate (randomness) all impact our ability to produce future excess return, we might assess our investment prospects with greater skepticism and more realism.
Similar to the foolishness of planting summer crops as the air starts to cool in the hope of repeating the rich harvest, expecting today a rerun of the amazing 9.8% a year real return from commercial property earned over the last 5 years should draw mirth from our neighbors. Heeding this practical lesson, we estimate an expected real return for US commercial property of 1.4% a year over the next decade. Under a scenario in which price and yield reversion in current cash flows are sticky around current levels, we estimate an average annualized expected real return of 2.6% over the next 10 years. Both estimates are in line with the exiguous returns of the 1990s. Prices today might appear high, but due to fundamentals— including new construction spend and vacancy rate—high prices, like an extended summer season, may be around longer than would otherwise be expected.
Endnotes
- The full list of income and expense items contained in the NCREIF data.
- All of our asset class returns are available on our Asset Allocation site.
References
Ip, Greg. 2016. “The Economy Is Again under the Sway of Asset Prices.” Wall Street Journal, July 27.
Nordby, Hans, and Michael Taylor. 2013. “The Price per Pound and Replacement Cost: The Effects of Q on Office Investment.” Journal of Portfolio Management, vol. 39, no 5 (Special Real Estate Issue): 76–88.

