A Smoother Path to Outperformance with Multi-Factor Smart Beta Investing
Researchers have identified hundreds of factors that purport to predict equity returns; we find a half dozen that provide an opportunity to outperform the market.
To maximize risk-adjusted returns, diversify across smart beta strategies that access the value, low beta, profitability, investment, momentum, and size factors.
Systematic rebalancing to fixed weights—reducing exposure to popular factors that have outperformed over recent years, while increasing exposure to the out-of-favor factors that have underperformed—in a portfolio of smart betas will likely improve performance relative to a buy-and-hold weighting.
Dynamically rebalancing factor exposures using short-term momentum and long-term reversal signals further improves the return.
Factor investing, also called smart beta, is rapidly displacing traditional stock picking—and for good reason. Traditional active management of equity mutual funds has delivered returns persistently below passive benchmarks. In contrast, many factor-based smart beta strategies have persistently outperformed the same capitalization-weighted benchmarks. As you consider migrating your public equity holdings away from traditional active management to smart beta, two portfolio construction questions come to the fore: which smart beta strategies should you include, and how should you manage those strategy allocations through time? We find that a smart beta strategy diversified across factors substantially reduces tracking error relative to the average of the single-factor strategies, and dynamic rebalancing materially increases expected return relative to rebalancing to equal weights.

Look Before You Leap
The advantages associated with systematic factor investing, such as low costs and transparency, have driven rapid growth in the number of smart beta funds. At the end of 2015 we counted more than 800 smart beta ETFs, not including mutual funds, separately managed accounts, and other investment vehicles. This nascent smart beta category does not come without its challenges, however.
Many factors are mirages that result from datamining. According to Harvey, Liu, and Zhu’s (2015) survey of the literature, top-tier academic journals document over 300 distinct factors and the number grows every year. We are not surprised. Professional success of an army of professors, assistant professors, and graduate students depends on publishing articles that “discover” new factors. Because the number of potential factors is practically unlimited, and stock price changes are largely random, hundreds of false positives are inevitable. To combat these datamining outcomes, academia is increasing the pressure on publications to institute stricter criteria in evaluating research that purports to identify new factors.
Many seemingly robust factors are simply exhausted past opportunities. Active quantitative investors are constantly searching for investment opportunities, and by the time academic researchers document a factor, investors have often already recognized it and deployed sufficient capital to eliminate its future profitability. No surprise that MacLean and Pontiff (2015) document significant reduction of factor efficacy after publication.
Some otherwise robust factors may even be dangerous. After a factor strategy has proved sufficiently profitable, investment flows attracted by its popularity can drive up the prices of stocks with that factor characteristic. Factors thereby become overvalued. Arnott, Beck, and Kalesnik (2016a,b) and Arnott et al. (2016) empirically demonstrate that strategies with rich valuations tend to provide poor subsequent performance. To avoid such underperformance, we suggest you look before you leap.
The Distinction between Factors and Smart Betas
Before we continue, let’s clarify how we define the following terms: factor, factor portfolio, smart beta, and smart beta strategy. Factor is a generic label for company and stock price characteristics that provide the common sources of return across the broad universe of equity securities.
We construct factor portfolios to measure and study factor returns. Factor portfolios are long stocks with the desired characteristic and short stocks with the undesired characteristic. For example, the value factor portfolio is long cheap stocks and short expensive stocks, and the size factor portfolio is long small stocks and short large stocks. An investor cannot practically invest in factor portfolios because of restrictions on shorting and leverage.
Smart beta is a label for simple, transparent, low-cost, systematic investment strategies, often designed to exploit factor research. Smart beta strategies are long-only portfolios that can be carefully engineered to avoid excessive implementation costs. Smart beta strategies are easy and inexpensive to invest in.
The Six Factors with the Most Robust Returns
Our research leads us to conclude that only a handful of factors represent genuine future return opportunities—strategies with the potential to outperform in the decades ahead. Following the findings of Fama and French (1993, 2012, 2015), we include in this group of six the four factors in their current model (looking beyond the market factor)—value, profitability, investment, and size—as well as low beta and momentum, two factors widely deemed robust in academic publications (Frazzini and Pedersen, 2014, and Carhart, 1997).
We construct these six factor portfolios in accordance with widely accepted academic practice. We summarize our factor portfolio construction method in Appendix A. All six factors demonstrate both statistically and practically significant returns. The average annualized factor return in the United States over our study period July 1973–September 2016 is 4.86%. The correlations across these factor returns are predominantly low or negative, with an average cross-correlation of 0.08, suggesting they are independent and thus able to provide strong diversification benefits.
In Appendix B we replicate the same six factor portfolios in three international markets—Japan, the United Kingdom, and Europe ex UK—over the period July 1993–September 2016. We choose these markets for their lengthy history and homogeneity of corporate domicile. Whereas not all factors display positive returns in all geographies, taken as a group the factors do show consistently strong out-of-sample returns. We intend to elaborate on our research validating these six factors in future publications; many of our detailed research findings on these equity factors are beyond the scope of this article.

A Few Observations about Factors
Drawing on the abundant literature dealing with factors, as well as our own research, we can make several observations relevant to factor portfolio construction; we refer primarily here to the US market. First, the low beta factor’s exceptionally strong return can be explained in part by its rising valuations. From today’s baseline of elevated prices in low-volatility stocks, the low beta factor may well provide disappointing returns over the next decade.
A second observation is that, on its own, profitability generates a low return. Despite its low return, however, profitability’s low and negative correlation with the other factors makes it a helpful addition to a diversified portfolio of factor strategies. Perhaps for this reason many smart beta providers combine profitability with other characteristics to create a composite quality factor.1
We also observe the relatively strong correlation between value and investment factor returns, which suggests that in combination the two factors may be redundant. This higher correlation is primarily the result of similar sector exposures. But, controlling for sector composition, we find that value and investment are robust independent factors.
We find that smaller stocks do not necessarily provide higher returns than larger stocks, consistent with Shumway and Warther (1999). We find that small size does provide such excess returns, however, when combined with other factors. Beck and Kalesnik (2014) argue that other factors provide stronger returns when applied to small companies because of the higher volatility and less-efficient pricing of small stocks. Similarly, Asness et al. (2015) find a strong factor return from a small-size factor after controlling for the quality characteristics of the issuing companies.
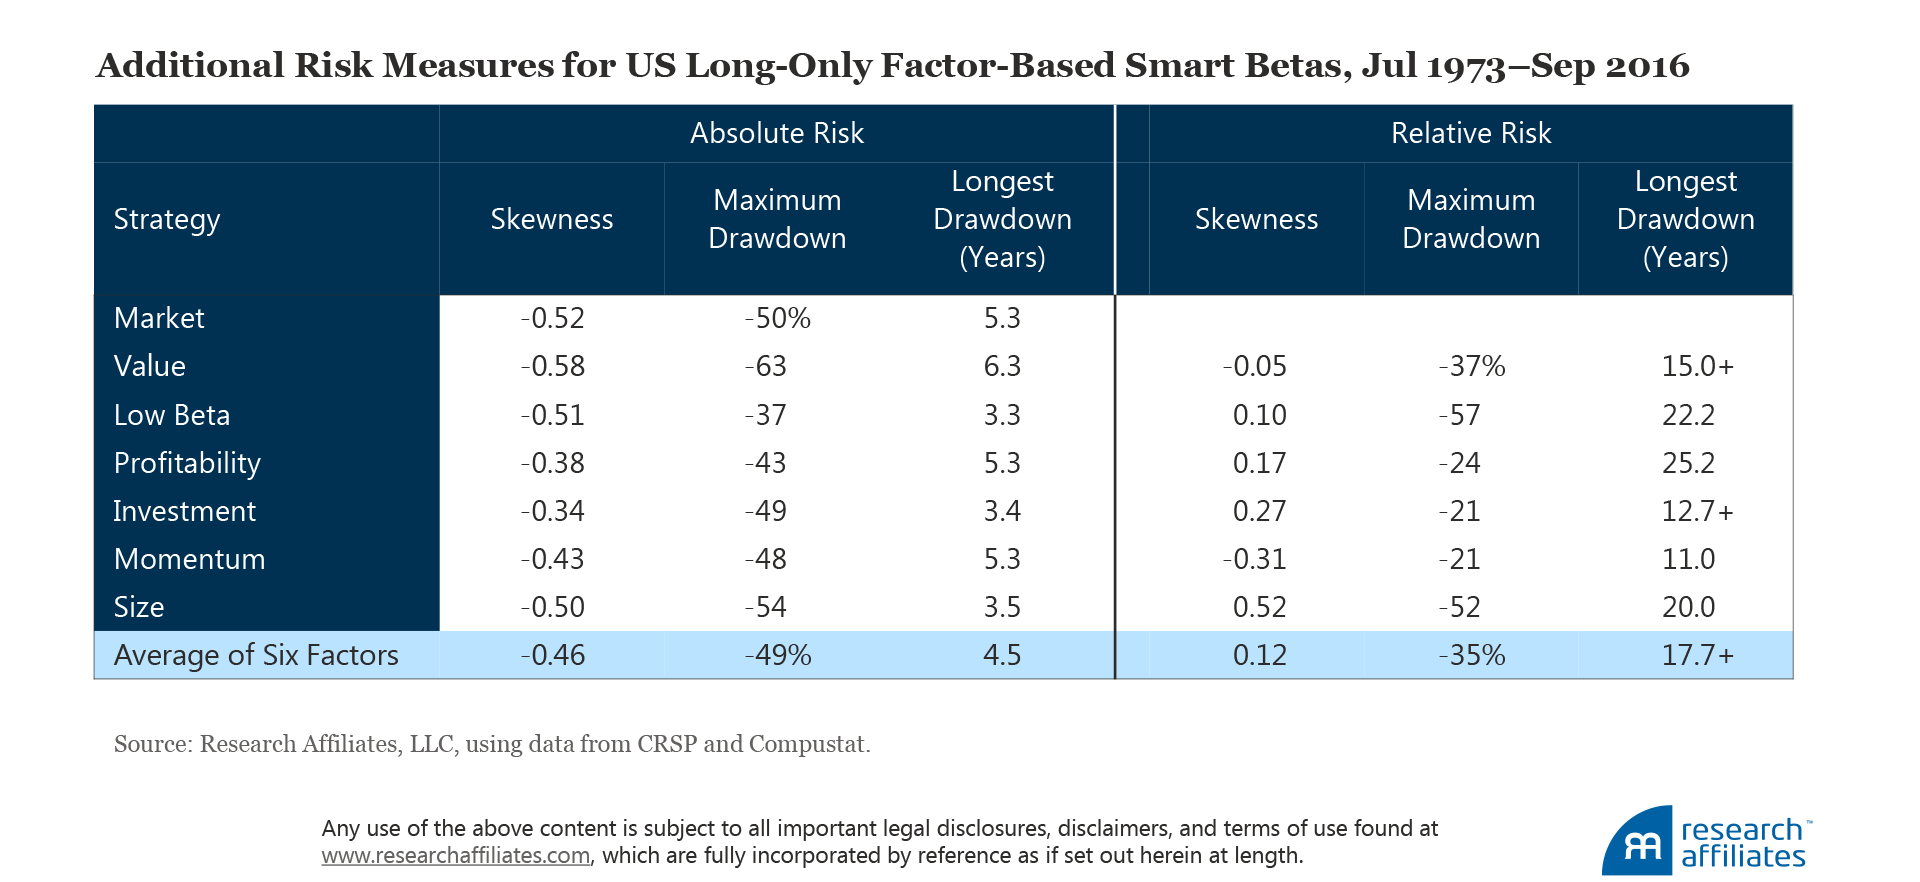
Finally, the factor returns demonstrated by academics using long–short portfolios offer an unrealistic assessment of the returns an investor is likely to earn in practice. The returns are before trading costs such as price impact, the cost of shorting stocks, and management fees. These real-world costs are not identical across all factors; Novy–Marx and Velikov (2015) and Beck et al. (2016) find that for some factors the trading costs are high enough to wipe out all the benefits, even if the strategy does not attract a large following.
Factor-Based Smart Betas
The prospect of an average annualized excess return of nearly 5% across six robust and largely independent factors helps explain the strong investor demand for factor investing. Alas, as we explained in the introduction, factor portfolios are impractical real-world investment strategies due to constraints on shorting and leverage. We can, however, apply our factor research to create simple, transparent, low-cost smart beta strategies that you can easily and inexpensively invest in.
We illustrate the opportunities for investing in real-world factor-based strategies by constructing six very simple long-only investable portfolios: value, low beta, profitability, investment, momentum, and size. Our factor-based smart beta portfolio construction methodology is explained in Appendix C.
As expected, real-world constraints dramatically reduce the simulated outperformance of our factor-based smart beta strategies relative to long–short factor portfolios. Yet the evidence of robustness remains impressive. The historical results for the US market suggest investors can earn an average value-add of 2.19% a year across these six smart beta strategies. The average tracking error is 7.10% and the average information ratio is 0.30. Most strategies produce results which pass tests of statistical significance at 95% confidence. A couple do not.
Out-of-sample robustness tests in Japan, United Kingdom, and Europe ex UK provide confirming, if somewhat weaker, evidence. Most strategies earn an excess return over the market benchmark, but in each of the international markets we study, a couple of the factor-based smart beta strategies generate mildly negative value-add. The average value-add of the six strategies remains well above 1.00% a year in all three out-of-sample geographies.
Correlations across our six smart betas are generally low and sometimes negative. Nine of the 15 strategy correlations of our six smart betas in the United States are near zero or negative, with an average excess return cross-correlation of 0.02. As with the six factors, these factor-based strategies capture independent sources of return and should provide strong benefits from diversification.
We confidently conclude from our study of factors that such smart beta strategies offer a significant opportunity for future value-add relative to the capitalization-weighted equity market. The magnitude of opportunity is in line with the historical simulation results we present here. Our decade of success in producing strong value-add, after fees and expenses, in live smart beta portfolios for many billions of dollars invested by real investors adds to our conviction.


Multi-Factor Smart Beta Strategies
The low and negative correlations across the excess returns of the six factor-based smart betas indicates strong diversification benefits by combining the strategies into a multi-factor portfolio. Theory suggests that the returns and value-add of a multi-factor smart beta portfolio should be similar to the average values of the factor strategies, but achieved at significantly lower risk levels. Lower relative risk would also be a reasonable expectation, experienced by lower tracking error and shorter periods of underperformance relative to the market.
We consider three different methods of combining smart beta strategies:
1. Buy and Hold: Allocate one-sixth of a portfolio to each of the six factor-based smart beta strategies and do not subsequently rebalance this mix.
2. Systematic Rebalancing: Allocate one-sixth of a portfolio to each of the six strategies and then rebalance back to a one-sixth allocation every quarter.
3. Dynamic Rebalancing: Set a default weight of one-sixth to each strategy and then modestly tilt allocations based on short-term price momentum and long-term price mean-reversion signals at each quarterly rebalance.
We provide more information about our factor timing methodology in Appendix D.

As expected, our diversified multi-factor smart beta strategies provide large and meaningful risk reduction. For the US portfolios, volatility is reduced by a full percentage point, from 16.4% for the average smart beta to between 15.2% and 15.6% for the multi-factor strategies. We cut tracking error in half, from an average of 7.10% to between 3.41% and 4.00% for the multi-factor portfolios. We double or better our information ratios from 0.30 to between 0.60 and 0.79.
Also, as we expect, buy-and-hold weighting produces value-add relatively close to the average individual factor strategy, 2.31% compared to 2.19%. The advantage of drifting into the highest performing strategy over the sample period is offset by the disadvantage of failing to profit from rebalancing. A move to simple systematic rebalancing to fixed weights increases the value add by 0.14% and 0.26% relative to the buy-and-hold and average factor strategies, respectively. Systematic rebalancing also provides the lowest risk and tracking error by ensuring the most consistent diversification.
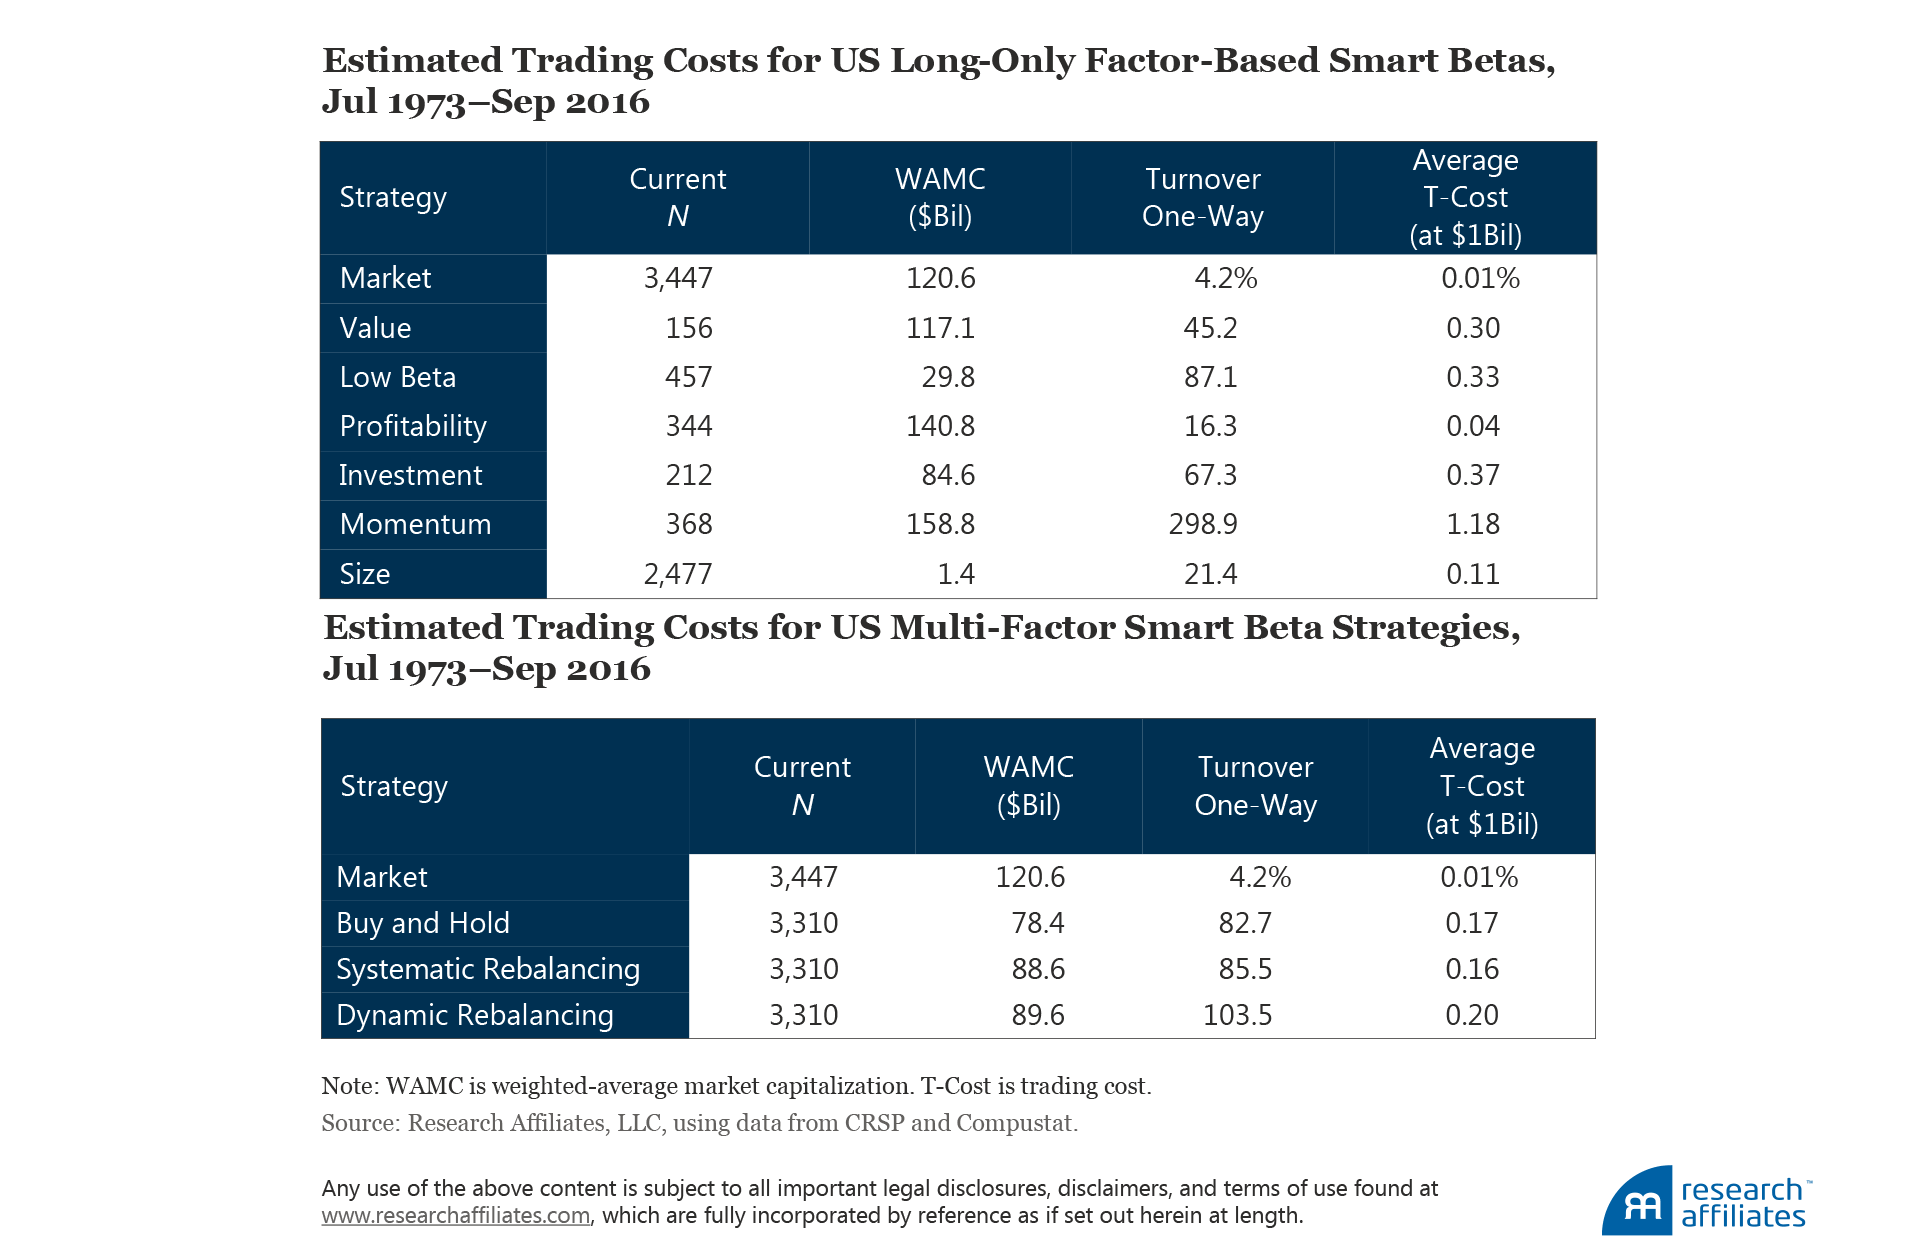
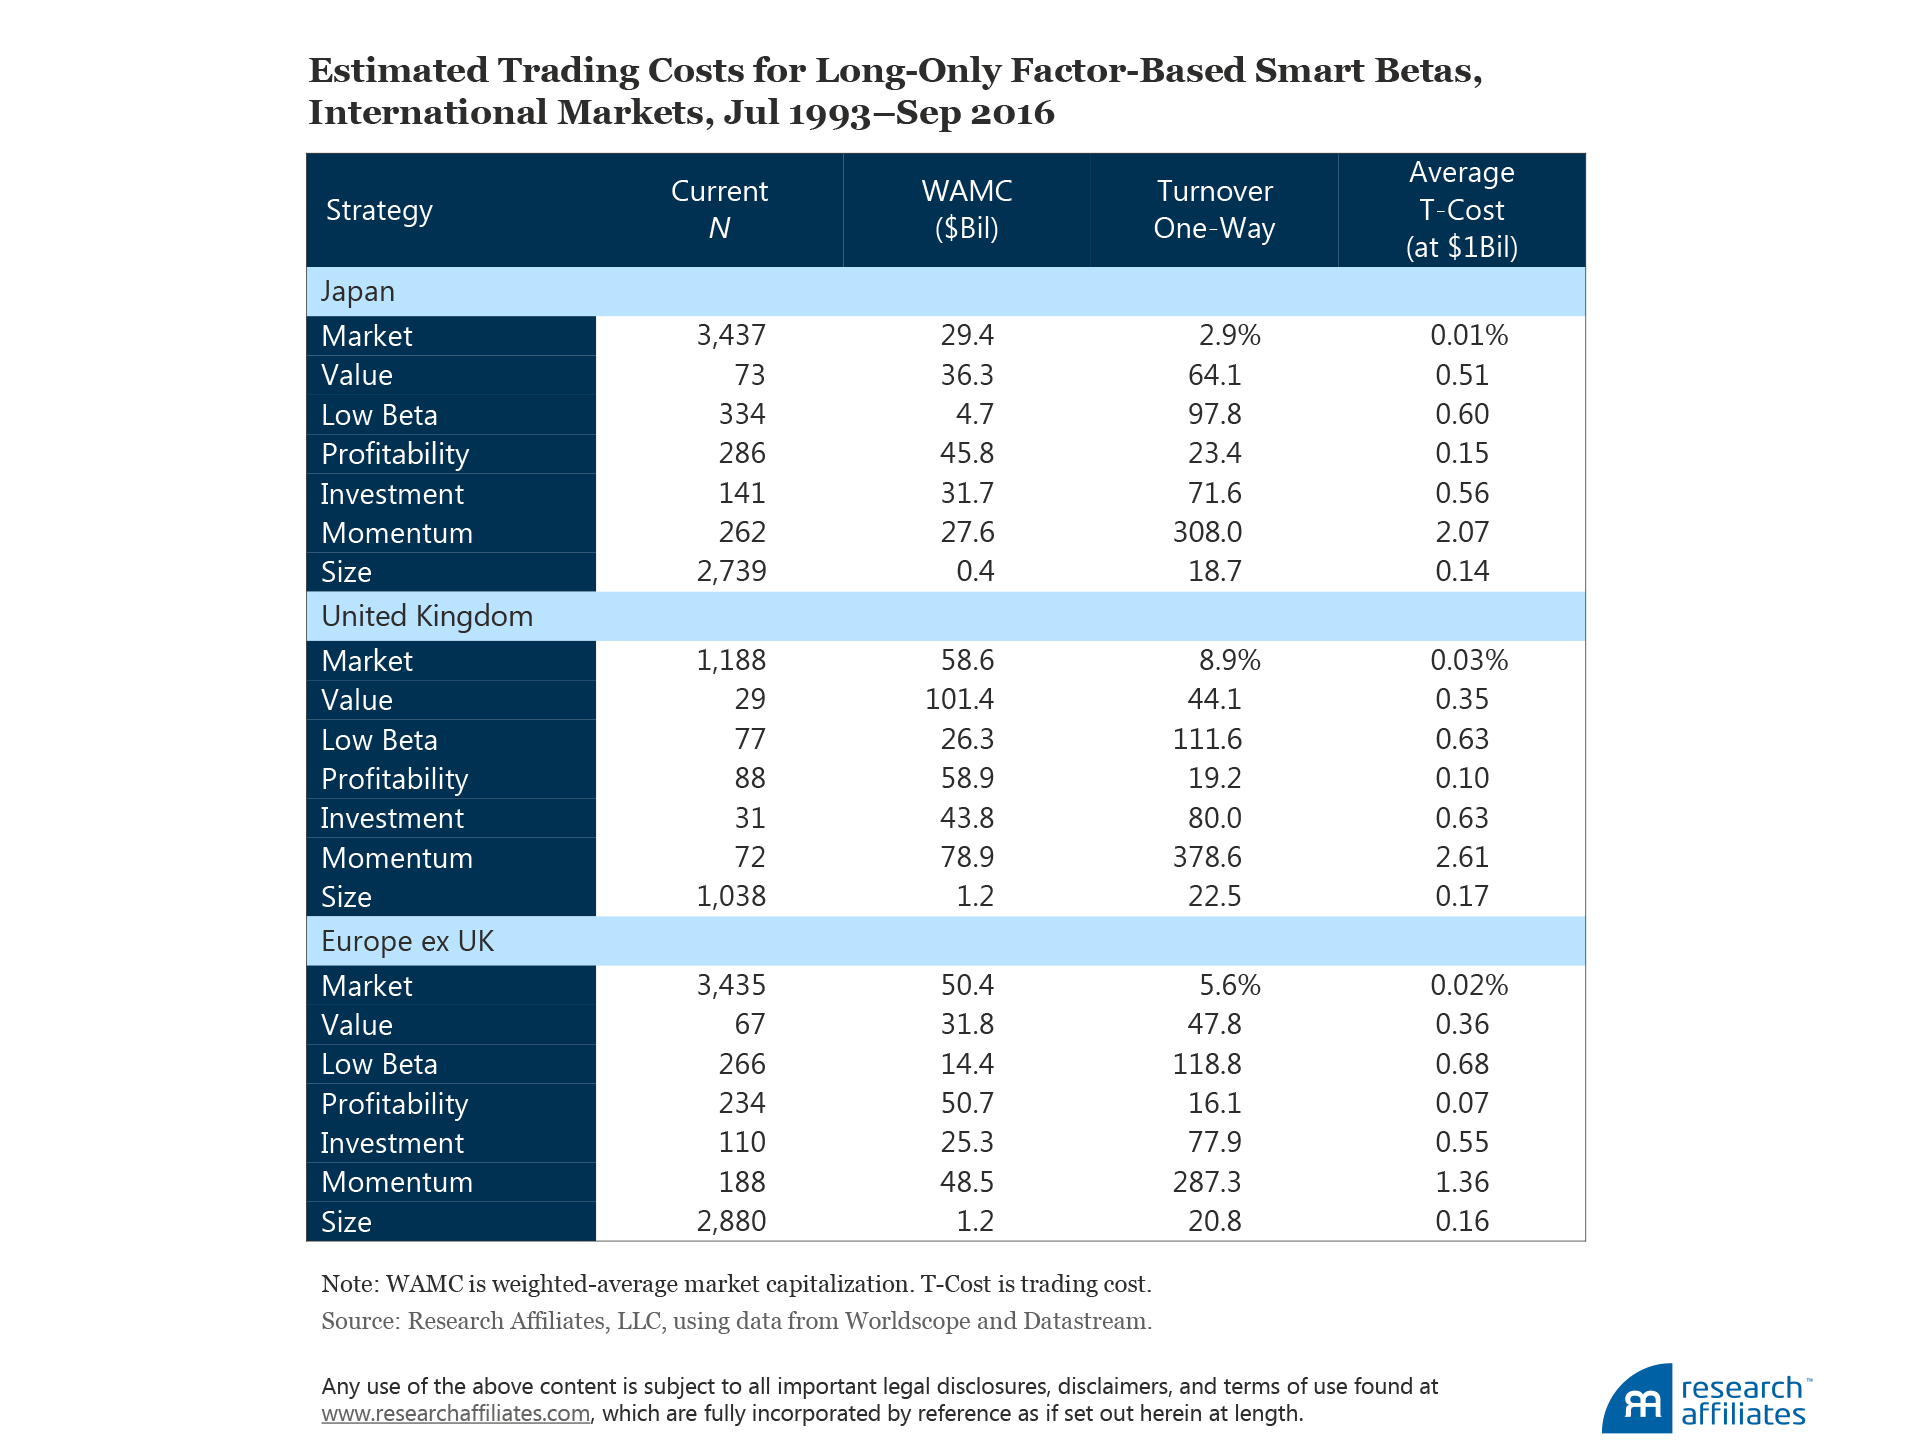
Nearly a full percentage point in return, however, is produced by dynamic rebalancing relative to the average individual factor strategy, with value-add rising from 2.19% to 3.16%. The extra value added from dynamic rebalancing relative to systematic rebalancing is also substantial, rising from 2.45% to 3.16%. If we consider trading costs, however, the improvement in value-add erodes slightly. Appendix E provides our method for estimating trading costs when applying the three weighting methods used in creating the diversified multi-factor smart beta strategies in the United States, Japan, United Kingdom, and Europe ex UK.
Importantly, the additional return captured by more strategic rebalancing changes the risk experience. For our US smart beta portfolios, we find that relative to systematic rebalancing, dynamic rebalancing slightly increases volatility and tracking error, but lowers drawdowns and the duration of periods of underperformance. Simply put, higher returns lower relative drawdowns.
As reported in Appendix F, the evidence of risk reduction is similarly strong across geographies, approximately halving tracking error from the range of 8–9% to 3–5%. The value added from both systematic and dynamic rebalancing is also significant relative to the average individual smart beta strategy, adding from about 0.3% to 1.2% of excess return.
Our international evidence does not confirm higher returns from rebalancing relative to a buy-and-hold weighting. In these markets with shorter histories, the benefit of sticking with the strategy with the best in-sample performance (i.e., low beta) offsets the return advantage of systematic rebalancing. We remain convinced that mean reversion will prevail over a long time horizon and that rebalancing will generate higher future returns.
A Smoother Path
You can outperform the market by investing in factor-based smart beta strategies, and you can obtain this outperformance with a smoother ride—that is, with substantially lower tracking error and shorter periods of underperformance—when you invest in a diversified portfolio of smart betas. In addition, our findings indicate you should benefit from the highest return and value-add, highest Sharpe and information ratio, and lowest drawdown and shortest period of underperformance if you dynamically rebalance your diversified portfolio of smart betas.2 Multi-factor equity investing combined with either dynamic or systematic rebalancing is a reliable strategy for outperforming the market without the burden of excessive volatility. We believe the evidence shows a smoother path to outperformance is paved through multi-factor smart beta investing.
Appendix A: Factor Portfolio Construction Methodology
To construct our portfolios in the United States we use the universe of US stocks from the CRSP/Compustat database. We define the US large-cap equity universe as stocks whose market capitalizations are greater than the median market capitalization on the NYSE, and the small-cap universe as stocks whose market capitalizations are smaller than the NYSE median. The US data extend from July 1973 to September 2016.
For international factor portfolios, we use the universe of stocks from the Worldscope/Datastream database. We define the international large-cap equity universe as stocks with market capitalization in the top 90% by cumulative market-cap within their region, where regions are defined as Japan, United Kingdom, and Europe ex UK. The small-cap universe is defined as the bottom 10% by cumulative market-cap. The international data extend from July 1993 to September 2016.
We divide each universe by the various factor signals to construct desired-characteristic (the long side) and undesired-characteristic (the short side) portfolios. We follow Fama and French (1993, 2012, 2015) in constructing value, size, profitability, investment, and momentum factor portfolios in both large- and small-cap universes. For example, to simulate the large-cap value factor in the United States, we construct the value portfolio from large-cap stocks above the 70thNYSE percentile by book-to-market ratio (desired characteristic), and we construct the growth portfolio from large-cap stocks below the 30th NYSE percentile (undesired characteristic). To simulate the small-value factor in the international markets, we construct the value portfolio from small-cap stocks above the 70thpercentile in their respective region (Japan, United Kingdom, and Europe ex UK) by book-to-market ratio, and the growth portfolio from small-cap stocks below the 30thpercentile in their respective region.
Each long-side or short-side portfolio is defined as the equal-weighted average of large- and small-cap portfolios. These portfolios are weighted by market capitalization and rebalanced annually each July, with the exception of momentum, which is rebalanced monthly. The long- and short-side portfolios are then used to form a long–short factor portfolio without leverage. For example, the value factor is the average return on small-value and large-value portfolios minus the average return on small-growth and large-growth portfolios:

We follow Frazzini and Pedersen (2014) in constructing the low beta factor. We use the median value as the breakpoint instead of the 70th and 30th percentiles. The high beta and low beta portfolios are weighted by the difference between beta ranks and average rank, and rebalanced monthly. The long–short portfolio is a self-financing zero-beta portfolio with leverage:

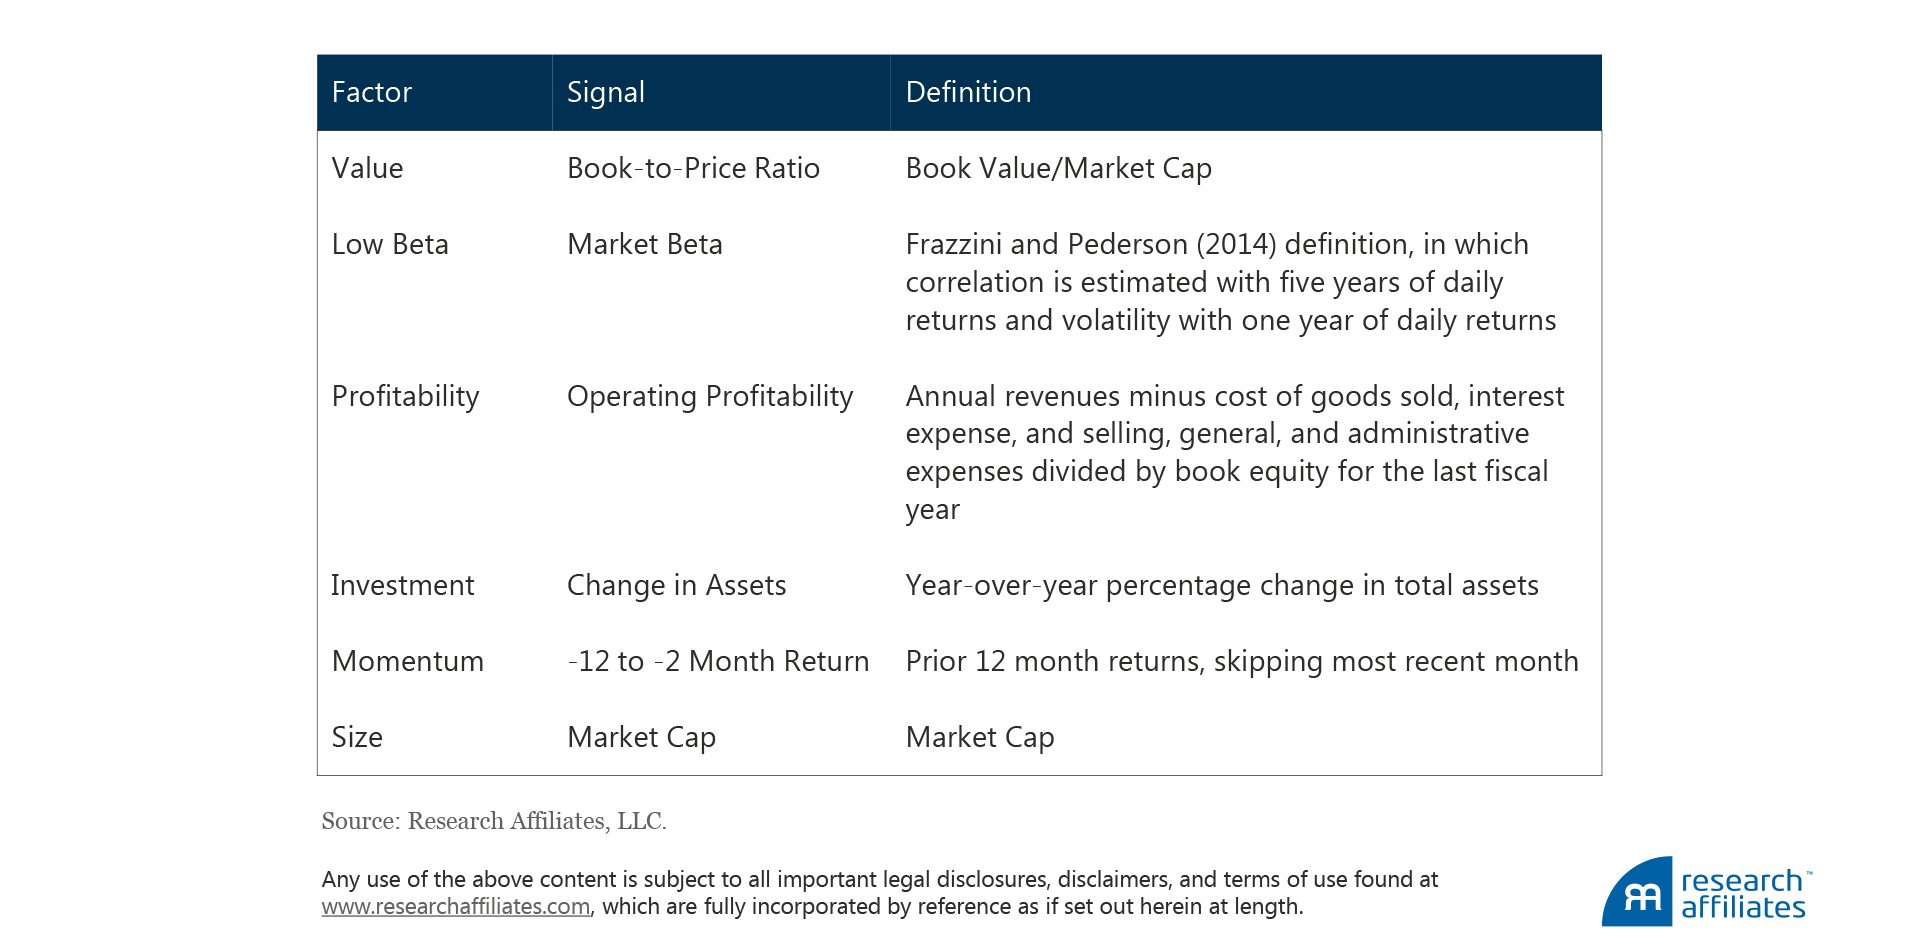
The signals used to sort the various factor portfolios are:

Note that slight variations in data cleaning and lagging could lead to slight differences between our factors and those of Fama and French and of Frazzini and Pedersen.
Appendix B: International Markets Factor Portfolios and Smart Beta Strategies


Appendix C: Smart Beta Strategy Construction Methodology
The factor-based smart beta portfolios, except the size strategy, are constructed from the large-cap universes only. We define the US large-cap equity universe as stocks whose market capitalizations are greater than the median market capitalization on the NYSE. We define the international large-cap equity universe as stocks with market capitalization in the top 90% by cumulative market-cap within their region, where regions are defined as Japan, United Kingdom, and Europe ex UK.
For the long-only investable portfolios, we select the top 30% of the large-cap universe for each of the factor characteristics, except for the low beta strategies for which we select the top 50%. For example, to simulate the value smart-beta strategy in the United States, we construct the portfolio from large-cap stocks above the 70th NYSE percentile by book-to-market ratio. To simulate the value smart-beta strategy in the international markets, we construct the portfolio from large-cap stocks above the 70th percentile in their respective region (Japan, United Kingdom, and Europe ex UK) by book-to-market ratio.
We then capitalization weight the selected stocks, except for low beta, which we weight by the difference between beta rank and average rank. The portfolios are rebalanced annually, except for momentum and low beta, which are rebalanced monthly.
Appendix D: Factor Timing Methodology
The following timing methods are employed across factors:

In the systematic timing method, we rebalance factor allocations to equal weights every quarter. In the dynamic timing method, we compute the cross-factor Z-score of the two timing signals every quarter, and take the average of the two. The Z-scores are capped at −3 and +3, and then used to adjust the systematic allocations as follows:

The factor allocations are renormalized after these adjustments.
Appendix E: Trading Cost Estimation
Trading cost, measured as a percentage reduction in portfolio return, is defined as

The number 0.03 derives from the empirical observation that trading 10% of average daily volume has 30 basis points of market impact. We assume $1B AUM for the current portfolios and retrospectively adjust the historical AUM in accordance with past market returns.


Appendix F: International Markets Multi-Factor Strategies


Endnotes
1. Beck et al. (2016) find various specifications of a quality factor are not robust to variations in factor definition and market geography. In a follow-up article to Beck et al., Hsu, Kalesnik, and Kose (forthcoming 2017) examine subgroups within the broad “quality” umbrella, finding that among the many characteristics used to define quality, only profitability and investment are robust to variations in factor definition and market geography.
2. We point to further evidence of the benefits of timing smart betas described in the series of articles published by Arnott, Beck, and Kalesnik in 2016.
References
Arnott, Rob, Noah Beck, and Vitali Kalesnik. 2016a. “To Win with ‘Smart Beta’ Ask If the Price Is Right.” Research Affiliates (June).
———. 2016b. “Timing ‘Smart Beta’ Strategies? Of Course! Buy Low, Sell High!” Research Affiliates (September).
Arnott, Robert D., Noah Beck, Vitali Kalesnik, and John West. 2016. “How Can ‘Smart Beta’ Go Horribly Wrong?” Research Affiliates (February).
Asness, Cliff, Andrea Frazzini, Ronen Israel, Tobias Moskowitz, and Lasse H. Pedersen. 2015. “Size Matters, If You Control Your Junk.” AQR Working paper (January 22).
Beck, Noah, Jason Hsu, Vitali Kalesnik, and Helge Kostka. 2016. “Will Your Factor Deliver? An Examination of Factor Robustness and Implementation Costs.” Financial Analysts Journal, vol. 72, no. 5 (September/October):32–56.
Beck, Noah, and Vitali Kalesnik. 2014. “Busting the Myth about Size.” Research Affiliates (December).
Carhart, Mark M. 1997. “On Persistence in Mutual Fund Performance.” Journal of Finance, vol. 52, no. 1 (March):57–82.
Fama, Eugene, and Kenneth R. French. 1993. “Common Risk Factors in the Returns on Stocks and Bonds.” Journal of Financial Economics, vol. 33:3–56.
———. 2012. “Size, Value, and Momentum in International Stock Returns.” Journal of Financial Economics, vol. 105, no. 3 (September):457–472.
———. 2015. “Dissecting Anomalies with a Five-Factor Model.” Fama–Miller Working Paper (June). Available at SSRN.
Frazzini, Andrea, and Lasse Heje Pedersen (2014). “Betting Against Beta.” Journal of Financial Economics, vol. 111, no. 1 (January): 1–25.
Harvey, Campbell R., Yan Liu, and Heqing Zhu. 2015. “…and the Cross-Section of Expected Returns.” Review of Financial Studies, vol. 29, no. 1 (October):5–68.
Hsu, Jason, Vitali Kalesnik, and Engin Kose. Forthcoming 2017. “A Survey of Quality Investing.”
MacLean, R. David, and Jeffrey Pontiff. 2015. “Does Academic Research Destroy Stock Return Predictability?” Journal of Finance, Forthcoming. Available at SSRN.
Novy–Marx, Robert, and Mihail Velikov. 2015. “A Taxonomy of Anomalies and Their Trading Costs.” Review of Financial Studies, vol. 29, no. 1:104–147.
Shumway, Tyler, and Vincent A. Warther. 1999. “The Delisting Bias in CRSP’s Nasdaq Data and Its Implications for the Size Effect.” Journal of Finance, vol. 54, no. 6 (December):2361–2379.


